Difference between revisions of "CIE chromaticity system"
| (3 intermediate revisions by the same user not shown) | |||
| Line 2: | Line 2: | ||
== Description == | == Description == | ||
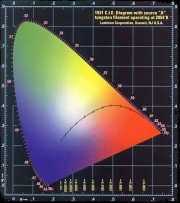
| − | A standard trichroma system for specifying colors that was developed by the Commission International de l'Eclairage (CIE) in 1931. The CIE color model is a visual perception system based on three colors, red (X), green (Y), and blue (Z) recognized by the color receptors in the eye. These primaries (X, Y, an Z) are called the tristimulus or trichroma values. The chromaticity coordinates (x, y, and z) are calculated as the fractional values of the three primaries. Since the sum of x, y and z equals 1, two of the fractional values are sufficient to define an unknown color. Thus a two-dimensional chromaticity diagram can be plotted with the x coordinate along the abscissa, and the y coordinate along the ordinate. The two-dimensional chromaticity diagram forms a parabolic curve where the pure spectral colors located on the edge. A straight line (purple boundary) joins the red and violet ends of the spectral locus. The achromatic colors (white, gray, black) occur in the third dimension along a line passing perpendicular through the center of the plot. The chromaticity diagram works well for the description of homogeneous color systems but can fail when used on | + | A standard trichroma system for specifying colors that was developed by the Commission International de l'Eclairage (CIE) in 1931. The CIE color model is a visual perception system based on three colors, red (X), green (Y), and blue (Z) recognized by the color receptors in the eye. These primaries (X, Y, an Z) are called the tristimulus or trichroma values. The chromaticity coordinates (x, y, and z) are calculated as the fractional values of the three primaries. Since the sum of x, y and z equals 1, two of the fractional values are sufficient to define an unknown color. Thus a two-dimensional chromaticity diagram can be plotted with the x coordinate along the abscissa, and the y coordinate along the ordinate. The two-dimensional chromaticity diagram forms a parabolic curve where the pure spectral colors located on the edge. A straight line (purple boundary) joins the red and violet ends of the spectral locus. The achromatic colors (white, gray, black) occur in the third dimension along a line passing perpendicular through the center of the plot. The chromaticity diagram works well for the description of homogeneous color systems but can fail when used on heterogeneous systems such as paints and dyes fibers. |
== Synonyms and Related Terms == | == Synonyms and Related Terms == | ||
| − | CIE color standard; CIE chromaticity diagram | + | CIE color standard; CIE chromaticity diagram; C.I.E |
==Resources and Citations== | ==Resources and Citations== | ||
| − | CIE: [ | + | * CIE: [https://www.fourmilab.ch/documents/specrend/ information] |
* Thomas B. Brill, ''Light Its Interaction with Art and Antiquities'', Plenum Press, New York City, 1980 | * Thomas B. Brill, ''Light Its Interaction with Art and Antiquities'', Plenum Press, New York City, 1980 | ||
| Line 16: | Line 16: | ||
* Website: http://www.arce.ukans.edu/book/color/classif.htm | * Website: http://www.arce.ukans.edu/book/color/classif.htm | ||
| + | * Ralph Mayer, ''A Dictionary of Art Terms and Techniques'', Harper and Row Publishers, New York, 1969 (also 1945 printing) | ||
[[Category:Materials database]] | [[Category:Materials database]] | ||
Latest revision as of 14:09, 11 May 2022
Description
A standard trichroma system for specifying colors that was developed by the Commission International de l'Eclairage (CIE) in 1931. The CIE color model is a visual perception system based on three colors, red (X), green (Y), and blue (Z) recognized by the color receptors in the eye. These primaries (X, Y, an Z) are called the tristimulus or trichroma values. The chromaticity coordinates (x, y, and z) are calculated as the fractional values of the three primaries. Since the sum of x, y and z equals 1, two of the fractional values are sufficient to define an unknown color. Thus a two-dimensional chromaticity diagram can be plotted with the x coordinate along the abscissa, and the y coordinate along the ordinate. The two-dimensional chromaticity diagram forms a parabolic curve where the pure spectral colors located on the edge. A straight line (purple boundary) joins the red and violet ends of the spectral locus. The achromatic colors (white, gray, black) occur in the third dimension along a line passing perpendicular through the center of the plot. The chromaticity diagram works well for the description of homogeneous color systems but can fail when used on heterogeneous systems such as paints and dyes fibers.
Synonyms and Related Terms
CIE color standard; CIE chromaticity diagram; C.I.E
Resources and Citations
- CIE: information
- Thomas B. Brill, Light Its Interaction with Art and Antiquities, Plenum Press, New York City, 1980
- Ralph Mayer, A Dictionary of Art Terms and Techniques, Harper and Row Publishers, New York, 1969 (also 1945 printing)
