2 03 5 NoirDeVigna EDS Spectrum.jpg
Original file (1,460 × 441 pixels, file size: 70 KB, MIME type: image/jpeg)
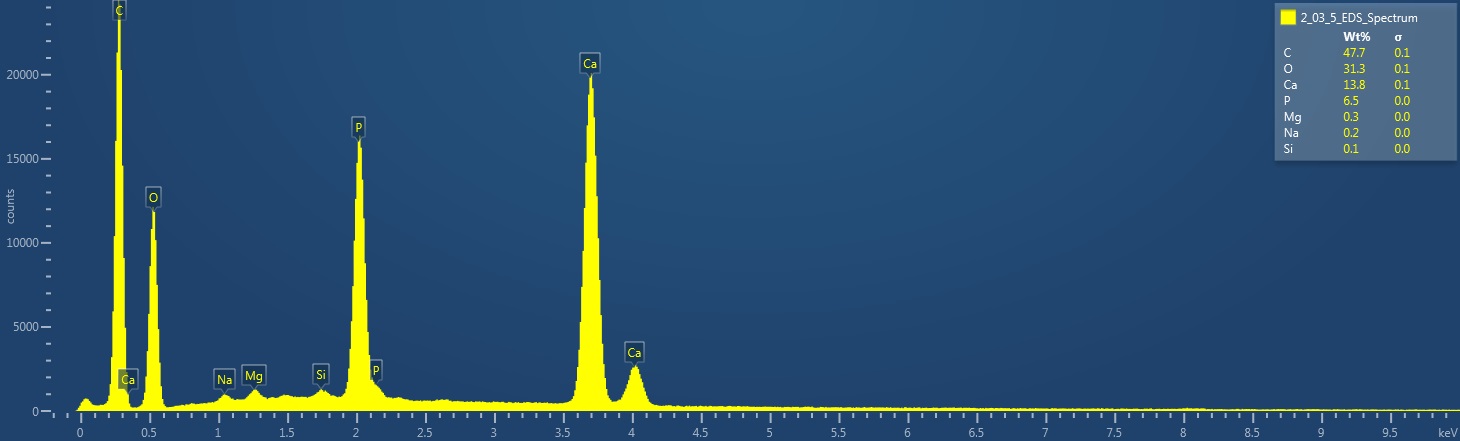
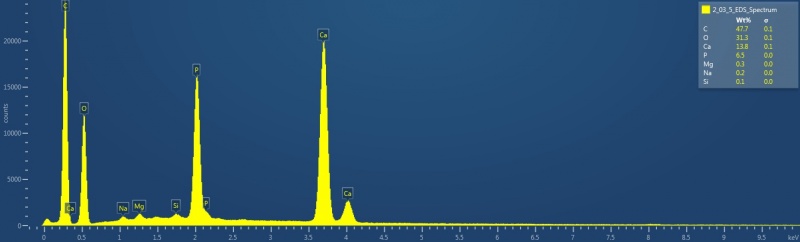
EDS Spectrum showing elemental peak height as a function of X-ray counts collected (LC)
Elements Identified Major (> 10%): carbon, oxygen, calcium. Minor (1-10%): phosphorus. Trace (< 1%): magnesium, sodium, silicon.
Area X-ray counts collected: 1,012,182. Live Time: 19.7 seconds. Magnification: 743x. Analyzed using Oxford X-Max80 energy-dispersive X-Ray spectroscopy (EDS) and Oxford AZtec platform software. Pigment sample was applied to carbon tape and mounted onto aluminum examination stub. X-rays from sample were excited by a 20 kV SEM electron beam in a low vacuum chamber (10 Pascal). The resolution of the X-Max80 silicon drift detector is 123 eV at MnKα wavelength.
File history
Click on a date/time to view the file as it appeared at that time.
| Date/Time | Thumbnail | Dimensions | User | Comment | |
|---|---|---|---|---|---|
| current | 14:24, 31 January 2017 | 1,460 × 441 (70 KB) | MKullman (talk | contribs) | EDS Spectrum showing elemental peak height as a function of X-ray counts collected (LC) Elements Identified Major (> 10%): carbon, oxygen, calcium. Minor (1-10%): phosphorus. Trace (< 1%): magnesium, sodium, silicon. Area X-ray counts collected: 1,... |
You cannot overwrite this file.
File usage
The following page uses this file: