Excitation emission matrix (EEM)

Description
The Excitation Emission Matrix (EEM) is a specific measurement that is becoming more widely used within the field of fluorescence spectroscopy. In a typical fluorescence (emission) measurement, the excitation wavelength is fixed and the detection wavelength varies, while in a fluorescence excitation measurement the detection wavelength is fixed and the excitation wavelength is varied across a region of interest. An emission map is measured by recording the emission spectra resulting from a range of excitation wavelengths and combining them all together. This compilation is a three dimensional scan that results can best be represented as a contour plot of excitation wavelength vs. emission wavelength vs. fluorescence intensity.


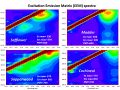
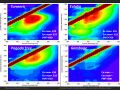
Excitation can occur at many wavelengths. When we set the instrument to scan through several excitation wavelengths, we can determine which wavelength excites the most molecules to fluoresce. This is called the Excitation maxima. Exposing the compound to this maximum excitation wavelength we can measure the emission curve The point with the highest emission is called the Emission max. For these three reds shown in the plot, their Excitation and Emission maxima are distinctly different. Additionally, the maxima that the emission for safflower is in the yellow region, madder is in the orange region, and sappanwood is in the red region.
THE MFA Scientific lab EEM instrument is set to step through the excitation wavelengths every 10 nm and collects a full emission curve at each excitation wavelength. So Instead of looking at the single line plots, we usually plot a contour map that provides the full data in the form of a three dimensional plot were the excitation wavelength is given on the vertical axis and the emission wavelength on the horizontal access. The intensity of the absorption or emission is given by the color with dark red being the most intense. The angled bar on the plot is where the excitation and emission wavelengths are identical, thus the detector is saturated at these points.
Synonyms and Related Terms
EEM; Excitation-emission matrix spectroscopy; Fluorescence spectroscopy; Fluorimetry; Spectrofluorimetry
Additional Images
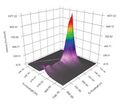
Excitation Emission Matrix plot from Horiba: EEM
3-dimensional contour plots for some organic reds; (MFA)
3-D EEM spectra for some common yellow colorants; (MFA)


Resources and Citations
- Wikipedia: Fluorescence spectroscopy
- Horiba: EEM