Derrick Fluorescence red comparison.jpg
Jump to navigation
Jump to search

Size of this preview: 800 × 600 pixels. Other resolution: 960 × 720 pixels.
Original file (960 × 720 pixels, file size: 183 KB, MIME type: image/jpeg)
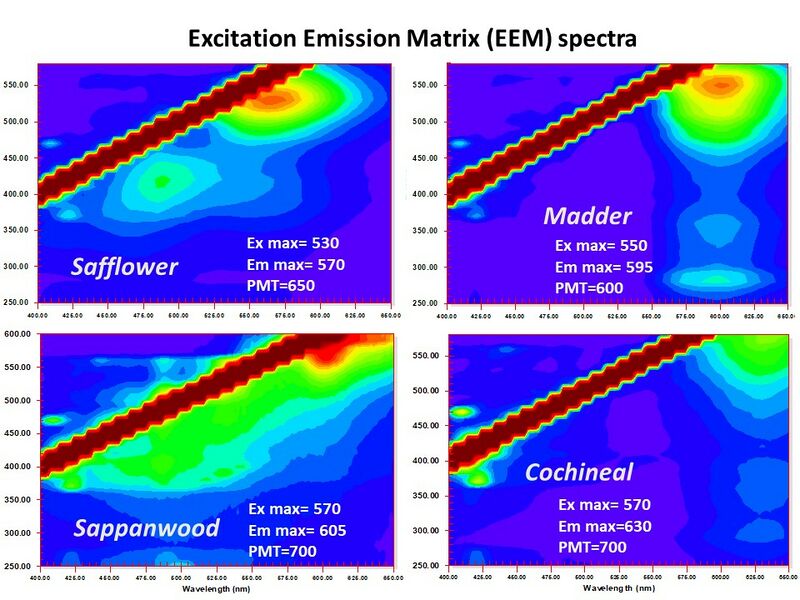
Three dimensional contour plot for three dimensional plot where the excitation wavelength is given on the vertical axis and the emission wavelength on the horizontal access. The intensity of the absorption or emission is given by the color with dark red being the most intense. The angled bar on the plot is where the excitation and emission wavelengths are identical, thus the detector is saturated at these points.
Shown here are the patterns for safflower, madder, sappanwood and cochineal. Each is distinct.
File history
Click on a date/time to view the file as it appeared at that time.
| Date/Time | Thumbnail | Dimensions | User | Comment | |
|---|---|---|---|---|---|
| current | 12:44, 22 June 2023 | | 960 × 720 (183 KB) | MDerrick (talk | contribs) |
You cannot overwrite this file.
File usage
The following page uses this file: