EEM analysis of Ukiyo-e prints: Difference between revisions
No edit summary |
|||
| (76 intermediate revisions by the same user not shown) | |||
| Line 1: | Line 1: | ||
[[File: Red UVVis images.jpg|500px|thumb|<center><small>Figure 1. Red reference colorants printed on Japanese paper, under visible light and long-wave ultraviolet radiation.</center></small>]] | |||
==Overview== | ==Overview== | ||
EEM analyses of reference samples of known colorants printed on paper of a similar type and with similar surface preparation to the woodblock print being analyzed can provide reasonable points of comparison for identifying fluorescing colorants in prints. However, the fluorescence of specific materials can be affected by concentration of the dye, mixture with other dyestuffs or pigments, or unknown differences in the preparation of the actual printed colorant as well as preparation of the reference dyes. Thus, not every example of a specific dyestuff will produce exactly the same EEM contour map. In addition, while analyses of reference samples prepared in the lab suggest that the major reds (safflower, madder, and sappanwood) should be able to be distinguished, this is not always the case. Different fluorescence spectrophotometers may also produce slightly different results. Figure 1 contains images of the three reds printed on Japanese paper, photographed in visible light and under long-wave ultraviolet radiation. | |||
As an aid in characterization, excitation and emission spectra can be extracted from the EEM data file. These better show the excitation and emission of a material than the 3D contour maps <ref>* 1. Richard Newman, Michele Derrick and Erin Mysak, “EEM Fluorescence Spectroscopy of Natural Red and Yellow Organic Colorants in Japanese Woodblock Prints,” in Aldo Romani, Austin Nevin, Daniela Comelli and Maria J. Melo (eds.), Molecular Luminescence in Cultural Heritage, Springer Set Fluoresc, [https://doi.org/10,1007/4243_2022_41 Link] </ref>. Analyses sometimes show spectra that do not very well match reference spectra from any of the three known organic reds that could have been used in the prints. In some instances, reds bleed through the paper during printing, and EEM data from front and back of a red area can be acquired. When these differ from one another (usually in a subtle fashion), it seems possible that a mixture of two main reds was probably used, one of which bleeds through the paper more easily than the other. | |||
Two of the three likely Edo period red organic colorants fluoresce strongly (safflower and madder) while the third only weakly (sappanwood). A fourth red colorant (cochineal), which did not come into use until about 1869 <ref>* 2. Anna Cesaratto, Yan-Bing Lueo, Henry D. Smith II, and Marco Leona, 'A timeline for the introduction of synthetic dyestuffs in Japan during the late Edo and Meiji periods', Heritage Science 6, 22 (2018) [https://www.nature.com/articles/s40494-018-0187-0 Link] </ref>, also usually fluoresces only weakly. In this database, EEM fluorescence is the only means for at least tentatively identifying these colorants. There is frequently uncertainty in interpreting results, however. It also appears that mixtures of more than one of these three may have been used at times – particularly mixtures of safflower and madder <ref>* 3. Lyndsay Kissell, Trine Quady, Dario Durastanti, Samantha Springer, and Jeannie Kenmotsu, “A Multi-Analytical Approach to Identify Red Colorants on Woodblock Prints Attributed to Suzuki Harunobu,” Heritage Science 10, 94 (2022), [https://doi.org/10.1186/s40494-022-00731-4 Link] </ref>. | |||
==EEM Reference Spectra== | |||
Figures 2-4 are representative EEM graphs for printed reference samples of the three common organic reds. Fluorescence of these colorants occurs between about 550-620 nm. Low level emission, present in most samples below about 500 nm, is mainly due to the paper substrate. Contour colors are dependent on intensity of the signal, which in turn is dependent on the detector setting and how strongly a particular material fluoresces. The excitation and emission maxima noted in the graphs are not necessarily those always exhibited by reference samples of these colorants. As noted above, it is possible to extract excitation and emission spectra at specific wavelengths from EEM data files. The examples in figures 5-6 are from reference printed safflower and madder. These spectra are not identical to those that may be acquired from reference samples prepared in slightly different ways, or applied to paper in different concentrations, and colorants on prints will not necessarily exactly match lab reference samples, which are reasons for caution in identifications based solely on EEM. | |||
=== | <gallery mode="packed" heights="220px"style="text-align:left"> | ||
Safflower color.PNG|180px|<center><small>Figure 2. EEM graph of safflower printed on Japanese paper.</center></small> | |||
11.13880-pt2-EEM.png|180px|<center><small>Figure 3. EEM graph of Japanese madder printed on Japanese paper.</center></small> | |||
Sappanwood EEM ref MFA.png|180px|<center><small>Figure 4. EEM graph of sappanwood printed on Japanese paper.</center></small> | |||
Figure 5 EEM for Ukiyo-e.png|250px|<small> Figure 5. Excitation spectra (red) and emission spectra (black) for reference safflower printed on Japanese paper. Excitation spectra at (top to bottom) 600 nm, 620 nm, and 640 nm emission. Emission spectra (top to bottom) at 510 nm, 490 nm, and 470 nm excitation.</small> | |||
Figure 6 EEM for Ukiyo-e.png|250px|<small> Figure 6. Excitation spectra (red) and emission spectra (black) for reference Japanese madder (Rubia akane) printed on Japanese paper. Excitation spectra at (top to bottom) 600 nm, 620 nm, and 640 nm emission. Emission spectra (top to bottom) at 510 nm, 490 nm, and 470 nm excitation.</small> | |||
</gallery> | |||
<gallery mode="packed" heights=" | For the likely organic yellow colorants, turmeric fluoresces quite strongly and is easily identified. Many other likely organic yellows are flavonoid-based colorants. They fluorescence relatively weakly and its pattern can only be suggestive that such a colorant is likely present. On the other hand, one yellow colorant said to have been in use during the Edo period is gamboge, which does not fluoresce at all. Thus, when a yellow region does not fluoresce and does not contain elements that suggest inorganic pigments, it may be suspected of containing gamboge. | ||
EEM | |||
==Analysis== | |||
Analyses sometimes show spectra that do not very well match reference spectra obtained from any of the pure organic reds. This could be for many reasons, such as paper types, aging, discoloration, dye preparation methods, etc. In some instances, reds bleed through the paper during printing and EEM data can optimally be acquired from both the front and back of a red area, then compared. In some cases, the colorant produces a clearer spectrum from the back. But in other cases, we found that the front and back differ from one another (usually in a subtle fashion), in the type of colorant, indicating that a mixture of two main reds was probably used; one of which bleeds through the paper more easily than the other. This possibility illustrates the complexities and potential uncertainties, in the interpretations of fluorescence data from organic reds in Japanese prints. An example for such a mixture is shown in the EEM graphs and extracted excitation and emission spectra from the front and back of the red sign on the tree in a 1762-1764 print by Suzuki Harunobu (figures 7-11). Note that the emission wavelength maximum on the front is slightly higher than that on the back. In addition, the EEM plot from the front appears to contain a second emission region at exactly the same emission wavelength maximum but at a considerably lower excitation wavelength maximum. We have consistently observed this phenomenon in plots from reference madder samples and have concluded that it is an instrumental anomaly. Our conclusion from the data on the front and back is that a mixture of safflower and madder was used, with the safflower component having more readily bled through the paper than the madder component. | |||
<gallery mode="packed" heights="250px"style="text-align:left"> | |||
Figure 7 EEM section.png|170px|<small>Figure 7. Kojima Bingo no Saburō Takanori, Suzuki Harunobu, about 1762-64. MFA 11.19633|link=Harunobu, Kojima Bingo no Saburô Takanori, 11.19633</small> | |||
11.19633-Pt5-front.jpg|170px|<center><small>Figure 8. EEM graph for red sign on tree on the front side of the Harunobu print, MFA 11.19633</small> | |||
Figure 9 EEM section.png|170px|<small>Figure 9. Excitation spectra (red) and emission spectra (black) for red sign on tree on the front side of the Harunobu print, MFA 11.19633. Excitation spectra at (top to bottom) 600 nm, 620 nm, and 640 nm emission. Emission spectra (top to bottom) at 510 nm, 490 nm, and 470 nm excitation.</small> | |||
1119633-Pt5-back.jpg|170px|<center><small>Figure 10. EEM graph for bleedthrough of red sign on tree on the back side of the Harunobu print, MFA 11.19633</small> | |||
Figure 11 EEM section.png|170px|Figure 11. Excitation spectra (red) and emission spectra (black) for bleedthrough of red sign on tree on the back side of the Harunobu print, MFA 11.19633. Excitation spectra at (top to bottom) 600 nm, 620 nm, and 640 nm emission. Emission spectra (top to bottom) at 510 nm, 490 nm, and 470 nm excitation. | |||
</gallery> | </gallery> | ||
== | ==References== | ||
[[Category: Ukiyo-e Print Colorant Database]] | |||
Latest revision as of 14:37, 4 October 2025

Overview
EEM analyses of reference samples of known colorants printed on paper of a similar type and with similar surface preparation to the woodblock print being analyzed can provide reasonable points of comparison for identifying fluorescing colorants in prints. However, the fluorescence of specific materials can be affected by concentration of the dye, mixture with other dyestuffs or pigments, or unknown differences in the preparation of the actual printed colorant as well as preparation of the reference dyes. Thus, not every example of a specific dyestuff will produce exactly the same EEM contour map. In addition, while analyses of reference samples prepared in the lab suggest that the major reds (safflower, madder, and sappanwood) should be able to be distinguished, this is not always the case. Different fluorescence spectrophotometers may also produce slightly different results. Figure 1 contains images of the three reds printed on Japanese paper, photographed in visible light and under long-wave ultraviolet radiation.
As an aid in characterization, excitation and emission spectra can be extracted from the EEM data file. These better show the excitation and emission of a material than the 3D contour maps [1]. Analyses sometimes show spectra that do not very well match reference spectra from any of the three known organic reds that could have been used in the prints. In some instances, reds bleed through the paper during printing, and EEM data from front and back of a red area can be acquired. When these differ from one another (usually in a subtle fashion), it seems possible that a mixture of two main reds was probably used, one of which bleeds through the paper more easily than the other.
Two of the three likely Edo period red organic colorants fluoresce strongly (safflower and madder) while the third only weakly (sappanwood). A fourth red colorant (cochineal), which did not come into use until about 1869 [2], also usually fluoresces only weakly. In this database, EEM fluorescence is the only means for at least tentatively identifying these colorants. There is frequently uncertainty in interpreting results, however. It also appears that mixtures of more than one of these three may have been used at times – particularly mixtures of safflower and madder [3].
EEM Reference Spectra
Figures 2-4 are representative EEM graphs for printed reference samples of the three common organic reds. Fluorescence of these colorants occurs between about 550-620 nm. Low level emission, present in most samples below about 500 nm, is mainly due to the paper substrate. Contour colors are dependent on intensity of the signal, which in turn is dependent on the detector setting and how strongly a particular material fluoresces. The excitation and emission maxima noted in the graphs are not necessarily those always exhibited by reference samples of these colorants. As noted above, it is possible to extract excitation and emission spectra at specific wavelengths from EEM data files. The examples in figures 5-6 are from reference printed safflower and madder. These spectra are not identical to those that may be acquired from reference samples prepared in slightly different ways, or applied to paper in different concentrations, and colorants on prints will not necessarily exactly match lab reference samples, which are reasons for caution in identifications based solely on EEM.

Figure 2. EEM graph of safflower printed on Japanese paper. 
Figure 3. EEM graph of Japanese madder printed on Japanese paper. 
Figure 4. EEM graph of sappanwood printed on Japanese paper. 
Figure 5. Excitation spectra (red) and emission spectra (black) for reference safflower printed on Japanese paper. Excitation spectra at (top to bottom) 600 nm, 620 nm, and 640 nm emission. Emission spectra (top to bottom) at 510 nm, 490 nm, and 470 nm excitation.

Figure 6. Excitation spectra (red) and emission spectra (black) for reference Japanese madder (Rubia akane) printed on Japanese paper. Excitation spectra at (top to bottom) 600 nm, 620 nm, and 640 nm emission. Emission spectra (top to bottom) at 510 nm, 490 nm, and 470 nm excitation.


For the likely organic yellow colorants, turmeric fluoresces quite strongly and is easily identified. Many other likely organic yellows are flavonoid-based colorants. They fluorescence relatively weakly and its pattern can only be suggestive that such a colorant is likely present. On the other hand, one yellow colorant said to have been in use during the Edo period is gamboge, which does not fluoresce at all. Thus, when a yellow region does not fluoresce and does not contain elements that suggest inorganic pigments, it may be suspected of containing gamboge.
Analysis
Analyses sometimes show spectra that do not very well match reference spectra obtained from any of the pure organic reds. This could be for many reasons, such as paper types, aging, discoloration, dye preparation methods, etc. In some instances, reds bleed through the paper during printing and EEM data can optimally be acquired from both the front and back of a red area, then compared. In some cases, the colorant produces a clearer spectrum from the back. But in other cases, we found that the front and back differ from one another (usually in a subtle fashion), in the type of colorant, indicating that a mixture of two main reds was probably used; one of which bleeds through the paper more easily than the other. This possibility illustrates the complexities and potential uncertainties, in the interpretations of fluorescence data from organic reds in Japanese prints. An example for such a mixture is shown in the EEM graphs and extracted excitation and emission spectra from the front and back of the red sign on the tree in a 1762-1764 print by Suzuki Harunobu (figures 7-11). Note that the emission wavelength maximum on the front is slightly higher than that on the back. In addition, the EEM plot from the front appears to contain a second emission region at exactly the same emission wavelength maximum but at a considerably lower excitation wavelength maximum. We have consistently observed this phenomenon in plots from reference madder samples and have concluded that it is an instrumental anomaly. Our conclusion from the data on the front and back is that a mixture of safflower and madder was used, with the safflower component having more readily bled through the paper than the madder component.

Figure 7. Kojima Bingo no Saburō Takanori, Suzuki Harunobu, about 1762-64. MFA 11.19633
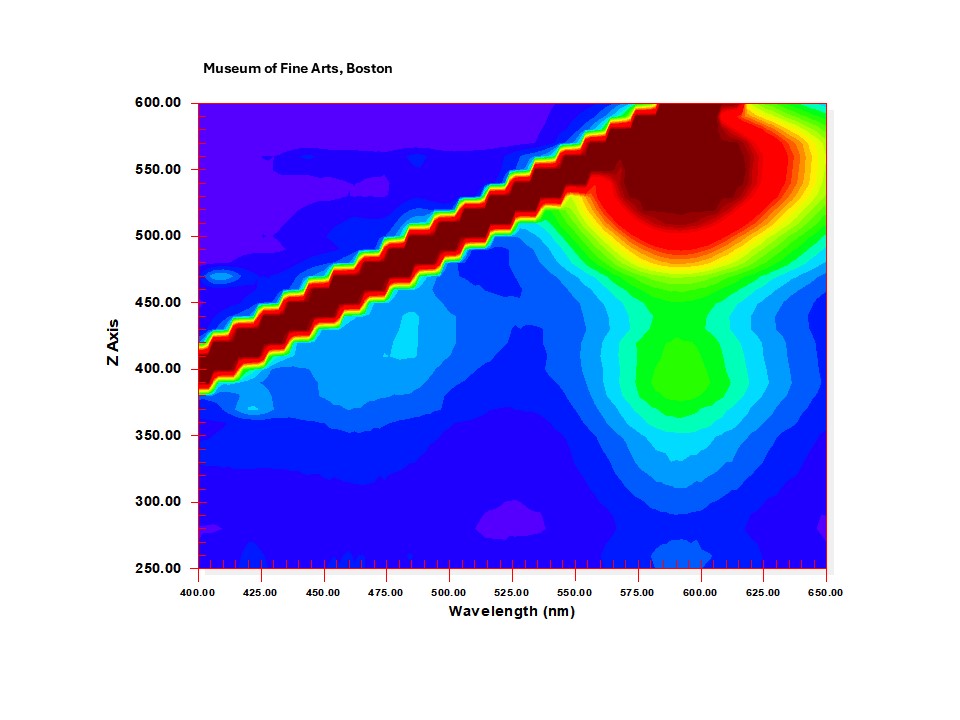
Figure 8. EEM graph for red sign on tree on the front side of the Harunobu print, MFA 11.19633 
Figure 9. Excitation spectra (red) and emission spectra (black) for red sign on tree on the front side of the Harunobu print, MFA 11.19633. Excitation spectra at (top to bottom) 600 nm, 620 nm, and 640 nm emission. Emission spectra (top to bottom) at 510 nm, 490 nm, and 470 nm excitation.
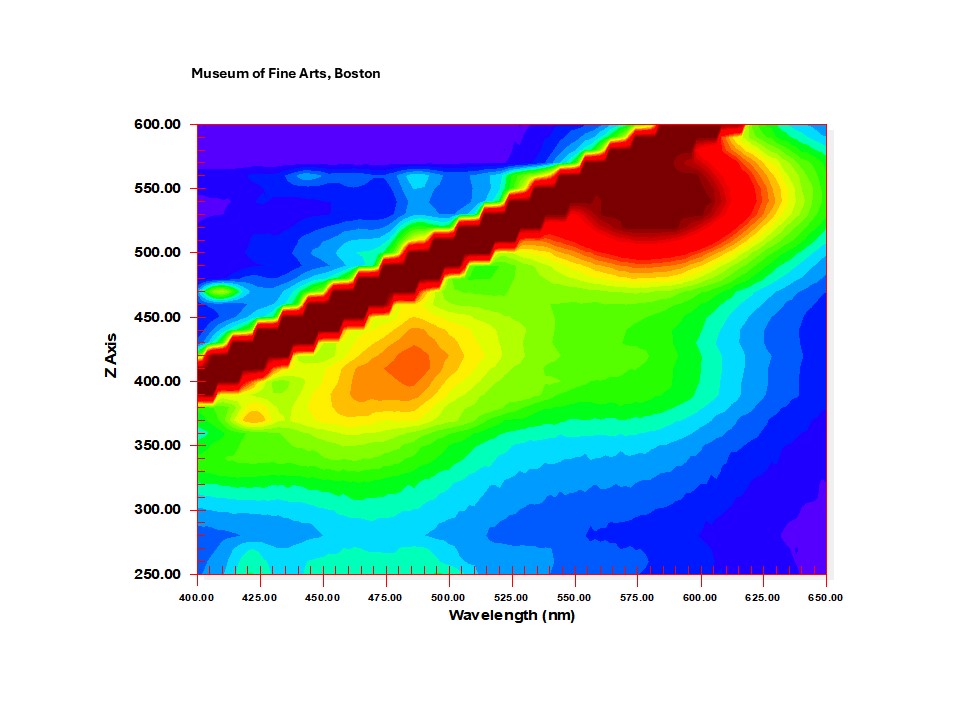
Figure 10. EEM graph for bleedthrough of red sign on tree on the back side of the Harunobu print, MFA 11.19633 
Figure 11. Excitation spectra (red) and emission spectra (black) for bleedthrough of red sign on tree on the back side of the Harunobu print, MFA 11.19633. Excitation spectra at (top to bottom) 600 nm, 620 nm, and 640 nm emission. Emission spectra (top to bottom) at 510 nm, 490 nm, and 470 nm excitation.


References
- ↑ * 1. Richard Newman, Michele Derrick and Erin Mysak, “EEM Fluorescence Spectroscopy of Natural Red and Yellow Organic Colorants in Japanese Woodblock Prints,” in Aldo Romani, Austin Nevin, Daniela Comelli and Maria J. Melo (eds.), Molecular Luminescence in Cultural Heritage, Springer Set Fluoresc, Link
- ↑ * 2. Anna Cesaratto, Yan-Bing Lueo, Henry D. Smith II, and Marco Leona, 'A timeline for the introduction of synthetic dyestuffs in Japan during the late Edo and Meiji periods', Heritage Science 6, 22 (2018) Link
- ↑ * 3. Lyndsay Kissell, Trine Quady, Dario Durastanti, Samantha Springer, and Jeannie Kenmotsu, “A Multi-Analytical Approach to Identify Red Colorants on Woodblock Prints Attributed to Suzuki Harunobu,” Heritage Science 10, 94 (2022), Link