Difference between revisions of "EEM analysis of Ukiyo-e prints"
| Line 6: | Line 6: | ||
==Ukiyo-e colorants== | ==Ukiyo-e colorants== | ||
| − | The excitation and emission maxima of the red colorants, safflower, madder, and sappanwood are similar but not identical (see | + | The excitation and emission maxima of the red colorants, safflower, madder, and sappanwood are similar but not identical (see below). The emission maxima for safflower is in the yellow-orange region, madder is in the orange region, and sappanwood is in the orange-red region. (Viewing these colorants side by side under ultraviolet illumination would show the subtle differences in tone.) |
| + | |||
The relative intensity of the absorption or emission is indicated by the color with dark red representing highest intensity. The oblique bar on the plot is where the excitation and emission wavelengths are identical, thus the detector is saturated at these points. | The relative intensity of the absorption or emission is indicated by the color with dark red representing highest intensity. The oblique bar on the plot is where the excitation and emission wavelengths are identical, thus the detector is saturated at these points. | ||
Revision as of 16:39, 24 April 2025
Overview
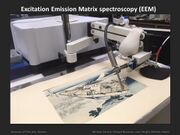
Some organic colorants used in Japanese woodblock prints can be characterize based on their ability to fluoresce when exposed to ultraviolet (and even visible) illumination. Excitation emission matrix (EEM) fluorescence spectrophotometry measures emission (fluorescence) of a material (in the visible range) as a function of the wavelength to which the material is exposed (in the ultraviolet as well as visible range). The typical display of results is a color contour map with excitation wavelength on the y-axis and emission wavelength on the x-axis. These maps can allow for (at least tentative) identification of some materials if the contour maps are visibly different for each of the potential materials. Even the lack of fluorescence, which indicates the material is non-fluorescent, may provide a key piece of information for identification of certain colorants. For this research, an Agilent Cary Eclipse Spectrometer with a fiber optic probe was used.
Ukiyo-e colorants
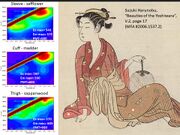
The excitation and emission maxima of the red colorants, safflower, madder, and sappanwood are similar but not identical (see below). The emission maxima for safflower is in the yellow-orange region, madder is in the orange region, and sappanwood is in the orange-red region. (Viewing these colorants side by side under ultraviolet illumination would show the subtle differences in tone.)
The relative intensity of the absorption or emission is indicated by the color with dark red representing highest intensity. The oblique bar on the plot is where the excitation and emission wavelengths are identical, thus the detector is saturated at these points.
Some of the yellows in ukiyo-e prints also fluoresce. For example, the strongly-fluorescing turmeric is easily identifiable by EEM. However, other organic yellow colorants such as Japanese pagoda tree (enju) and gardenia (kuchinashi), which belong to a general chemical class known as flavonoids, exhibit relatively little fluorescence, and while their presence can be hypothesized by EEM, they are difficult to differentiate from one another.
Raw data
The spectra and patterns are examples of the raw data collected by each analytical method. For the Ukiyo-e database, these data are interpreted by conservation scientists experienced in the particular analytical technique to identify the colorant. As such, only the interpreted results, not the raw data, are given for each print.
Limitations
As noted above, specific red or yellow dyestuffs may display characteristic EEM graphs that can be used to compare with graphs from prints to identify different dyestuffs. However, the fluorescence of specific materials can be affected by concentration of the dye, mixture with other dyestuffs or pigments, or unknown differences in the preparation of the dye for use as an ink on the print and the preparation of the reference dyes. Thus not every example of a specific dyestuff will produce exactly the same EEM contour map. In addition, while analyses of reference samples prepared in the lab suggest that the major reds – safflower, madder, and sappanwood, should be able to be distinguished, this is not always the case. As an aid in characterization, excitation and emission spectra can be extracted from the EEM data file. These better show the excitation and emission of a material than the 3D contour maps. Analyses sometimes show spectra that do not very well match reference spectra from any of the three known organic reds that could have been used in the prints. In some instances, reds bleed through the paper during printing, and EEM data from front and back of a red area can be acquired. When these differ from one another (usually in a subtle fashion), it seems possible that a mixture of two main reds was probably used, one of which bleeds through the paper more easily than the other.
One example illustrates the complexities, and potential uncertainties, in interpretations of fluorescence data from organic reds in Japanese prints.


