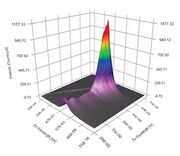
Excitation emission matrix (EEM)
Description
The Excitation Emission Matrix (EEM) is a specific measurement that is becoming more widely used within the field of fluorescence spectroscopy. An EEM compilation is essentially a three dimensional scan that results in a contour plot of excitation wavelength vs. emission wavelength vs. fluorescence intensity.
A type of electromagnetic spectroscopy that analyzes fluorescence from a sample. Fluorescence spectroscopy involves using a beam of light, usually ultraviolet light, that excites the electrons in molecules of certain compounds and causes them to emit light; typically, but not necessarily, visible light. A complementary technique is Absorption spectroscopy.
In a typical fluorescence (emission) measurement, the excitation wavelength is fixed and the detection wavelength varies, while in a fluorescence excitation measurement the detection wavelength is fixed and the excitation wavelength is varied across a region of interest. An emission map is measured by recording the emission spectra resulting from a range of excitation wavelengths and combining them all together. This is a three dimensional surface data set: emission intensity as a function of excitation and emission wavelengths, and is typically depicted as a contour map.
Synonyms and Related Terms
EEM; Excitation-emission matrix spectroscopy; Flourescence spectroscopy; fluorimetry; spectrofluorometry
Resources and Citations
- Wikipedia: Fluorescence spectroscopy
- Horiba: EEM
