Search results
Jump to navigation
Jump to search
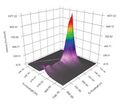
Excitation Emission Matrix Horiba.jpg Excitation Emission Matrix (EEM) A contour plot of excitation wavelength vs emission wavelength vs. fluorescence intensity,(1,400 × 1,215 (72 KB)) - 14:37, 21 June 2023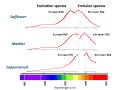
Derrick Fluorescence reds max.jpg ...ch wavelength excites the most molecules to fluoresce. This is called the Excitation maxima. (safflower, madder, sappanwood) Exposing the compound to this maximum excitation wavelength we can measure the emission curve And the point with the highest emission(960 × 720 (81 KB)) - 12:41, 22 June 2023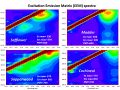
Derrick Fluorescence red comparison.jpg ...dark red being the most intense. The angled bar on the plot is where the excitation and emission wavelengths are identical, thus the detector is saturated at t(960 × 720 (183 KB)) - 12:44, 22 June 2023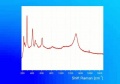
Redjasper632.jpg Raman spectrum of dry pigment collected at excitation wavelength of 632.8 nm. Image credit: University of Catania, at [http://www.ct.infn.it(1,200 × 837 (50 KB)) - 12:03, 3 January 2023


