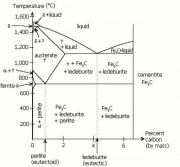
Phase diagram
Revision as of 13:31, 27 April 2013 by (username removed)
Description
A 3-coordinate graph that uses temperature, pressure, and composition to indicate the regions of stability for varying phases within a system, such as a mineral or an alloy. A binary phase diagram is a plot of two metallic components.
Synonyms and Related Terms
Phasendiagramm (Deut.); diagramme de phase (Fr.);
Authority
- David C. Scott, David C. Scott, Metallography and Microstructure of Ancient and Historic Metals, The Getty Conservation Institute, Los Angeles, 1991
- Random House, Random House, Webster's Encyclopedic Unabridged Dictionary of the English Language, Grammercy Book, New York, 1997
- Wikipedia, the free encyclopedia, at http://www.wikipedia.com Comment: http://en.wikipedia.org/wiki/Phase_diagram (Accessed Feb. 10, 2006)
