Madder (Rubia tinctorum) LC
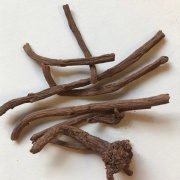
Description
Historical importance
Examples:
Summary of results
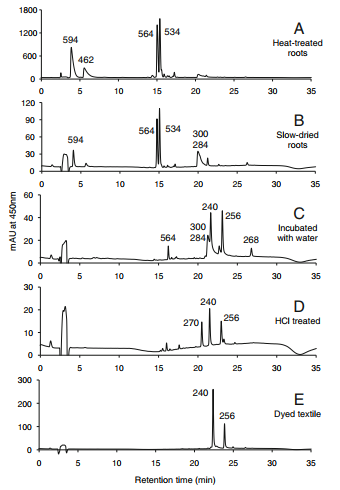
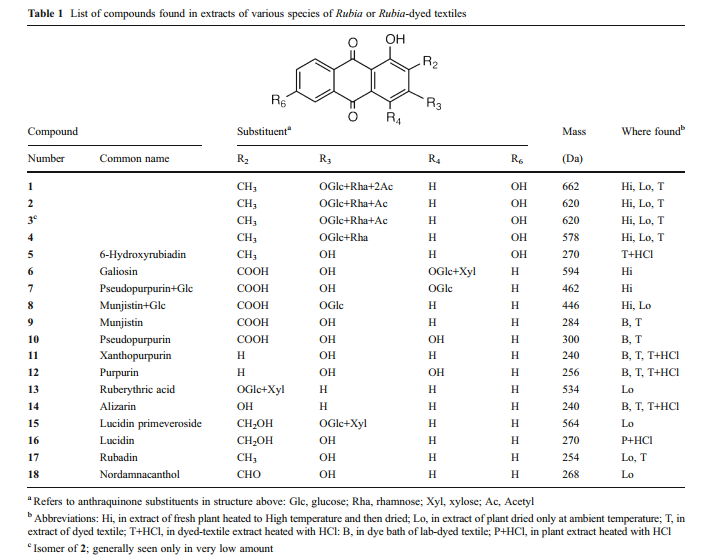
Extracts of textiles dyed with R. tinctorum are characterized by the presence of a large alizarin (table 1, compound # 14) peak and a generally smaller (or sometimes practically non-existent) purpurin (12) peak. However, it is well known that the roots of R. tinctorum contain an alizarin precursor, ruberythric acid (alizarin primeveroside, 13) as well as the primeveroside of lucidin (15), which appear here as peaks with respective masses of 534 Da and 564 Da.[1]
Analytical instrumentation and procedures
Extraction of plant material
Samples of plant specimens were extracted by heating about 10 mg of the ground or chopped, dry plant with 1.0 mL of methanol/water (1:1) at 65 °C for 1 h. The supernatant liquid was removed by pipet and was centrifuged at 12,000 rpm for about 5 min, after which the clear supernatant was subjected to analysis. This solution was diluted with methanol/water (1:1) if necessary.
Extraction of dyed textiles or fibers
Dyed textile or yarn specimens were extracted using a “soft” procedure, namely, by heating approximately 0.1–1 mg of fibers in 200 μL of a solution of pyridine/water/1.0 M oxalic acid in water (95:95:10) at 100 °C for 15 min.
HCl treated
The plant extracts were heated in 2 M HCl at 95 °C for 60 min to hydrolyze O-glycosides or to promote decarboxylation.
Analysis of dye components
Extracts of plant material or of dyed silk or wool were analyzed by HPLC with photodiode array and mass spectrometric detection using an Agilent 1100 high performance liquid chromatography system consisting of an automatic injector, a gradient pump, a Hewlett-Packard series 1100 photodiode array detector, and an Agilent series 1100 VL on-line atmospheric pressure ionization electrospray ionization mass spectrometer. Operation of the system and data analysis were done using ChemStation software, and detection was generally done in the negative ion [M-H]– mode. Separation of dye components was made, in the majority of cases, on a Vydac C18 reversed phase column (2.1 µm dia.×250 µm long; 5-µm particle size). Columns were eluted with acetonitrile-water gradients containing 0.1 % formic acid in both solvents.
Chromatograms
HPLC profiles for Rubia tinctoria. Elution was monitored at 450 nm. The numbers over the peaks are the molecule masses of the principal of otherwise significant components [1].
Sample information
Identified compounds
References
[1] Chika Mouri and Richard Laursen "Identification of anthraquinone markers for distinguishing Rubia species in madder-dyed textiles by HPLC" Microchimica Acta October 2012, Volume 179, Issue 1–2, pp 105–113


