Uploads by MKullman
Jump to navigation
Jump to search
This special page shows all uploaded files.
| Date | Name | Thumbnail | Size | Description | Versions |
|---|---|---|---|---|---|
| 11:06, 6 February 2017 | 2 07 1 BlueBlackRoberson EDS Spectrum.jpg (file) |  |
50 KB | EDS Spectrum showing elemental peak height as a function of X-ray counts collected (LC) Elements Identified Major (> 10%): carbon, oxygen. Minor (1-10%): NA. Trace (< 1%): NA. Area X-ray counts collected: 1,013,443. Live Time: 12.3 seconds. Magnifi... | 1 |
| 15:07, 26 January 2017 | 2 02 6 IvoryBlackWeber EDS Spectrum.jpg (file) |  |
53 KB | EDS Spectrum showing elemental peak height as a function of X-ray counts collected (LC) Elements Identified Major (> 10%): carbon, oxygen. Minor (1-10%): NA. Trace (< 1%): sulfur. Area X-ray counts collected: 1,017,081. Live Time: 21.4 seconds. Mag... | 1 |
| 15:38, 25 January 2017 | 2 01 10 LampBlack EDS Spectrum.jpg (file) |  |
53 KB | EDS Spectrum showing elemental peak height as a function of X-ray counts collected (LC) Elements Identified Major (> 10%): carbon, oxygen. Minor (1-10%): NA. Trace (< 1%): sulfur. Area X-ray counts collected: 1,012,732. Live Time: 12.9 seconds. Mag... | 1 |
| 10:41, 5 January 2017 | 1 05 7 FlakeWhite EDS Spectrum.jpg (file) |  |
59 KB | EDS Spectrum showing elemental peak height as a function of X-ray counts collected (LC) Elements Identified Major (> 10%): lead, oxygen, carbon Minor (1-10%): NA Trace (< 1%): NA Area X-ray counts collected: 1,011,105 Live Time: 27.1 seconds Magnif... | 1 |
| 10:51, 10 January 2017 | 1 01 16 WampumPowder EDS Spectrum.jpg (file) |  |
59 KB | EDS Spectrum showing elemental peak height as a function of X-ray counts collected (LC) Elements Identified Major (> 10%): oxygen, calcium, carbon. Minor (1-10%): NA. Trace (< 1%): NA. Area X-ray counts collected: 1,015,476. Live Time: 35.8 seconds... | 1 |
| 13:44, 17 January 2017 | 1 20 6 Suisho EDS Spectrum.jpg (file) | 59 KB | EDS Spectrum showing elemental peak height as a function of X-ray counts collected (LC) Elements Identified Major (> 10%): oxygen, silicon, carbon. Minor (1-10%): NA. Trace (< 1%): NA. Area X-ray counts collected: 1,019,126. Live Time: 47.5 seconds... | 1 | |
| 15:01, 5 January 2017 | 1 05 9 FlakeWhiteRoberson EDS Spectrum.jpg (file) |  |
59 KB | EDS Spectrum showing elemental peak height as a function of X-ray counts collected (LC) Elements Identified Major (> 10%): lead, oxygen, carbon Minor (1-10%): NA Trace (< 1%): NA Area X-ray counts collected: 1,010,552 Live Time: 23.8 seconds Magnif... | 1 |
| 09:26, 5 January 2017 | 1 01 14 FinePlasterersLime EDS Spectrum.jpg (file) |  |
59 KB | EDS Spectrum showing elemental peak height as a function of X-ray counts collected (LC) Elements Identified Major (> 10%): oxygen, carbon, calcium Minor (1-10%): magnesium Trace (< 1%): NA Area X-ray counts collected: 1,018,156 Live Time: 41.8 seco... | 1 |
| 14:20, 25 January 2017 | 2 01 7 Charcoal EDS Spectrum.jpg (file) |  |
59 KB | EDS Spectrum showing elemental peak height as a function of X-ray counts collected (LC) Elements Identified Major (> 10%): carbon, oxygen. Minor (1-10%): calcium. Trace (< 1%): iron, silicon, potassium, sulfur. Area X-ray counts collected: 1,015,88... | 1 |
| 10:29, 10 January 2017 | 1 05 8 LeadWhite EDS Spectrum.jpg (file) |  |
60 KB | EDS Spectrum showing elemental peak height as a function of X-ray counts collected (LC) Elements Identified Major (> 10%): lead, carbon,oxygen. Minor (1-10%): NA. Trace (< 1%): NA. Area X-ray counts collected: 1,012,149. Live Time: 18.6 seconds. Ma... | 1 |
| 15:24, 4 January 2017 | 1 01 13 GessoBologna EDS Spectrum.jpg (file) |  |
60 KB | EDS Spectrum showing elemental peak height as a function of X-ray counts collected (LC) Elements Identified Major (> 10%): oxygen, carbon, calcium Minor (1-10%): NA Trace (< 1%): silicon Area X-ray counts collected: 1,016,168 Live Time: 37.8 seconds... | 1 |
| 15:07, 10 January 2017 | 1 06 6 ZincWhite EDS Spectrum.jpg (file) |  |
61 KB | EDS Spectrum showing elemental peak height as a function of X-ray counts collected (LC) Elements Identified Major (> 10%): zinc, oxygen, carbon. Minor (1-10%): NA. Trace (< 1%): lead, chlorine. Area X-ray counts collected: 1,011,879. Live Time: 24.... | 1 |
| 13:54, 10 January 2017 | 1 06 3 ZincWhiteLefranc EDS Spectrum.jpg (file) |  |
62 KB | EDS Spectrum showing elemental peak height as a function of X-ray counts collected (LC) Elements Identified Major (> 10%): zinc, carbon, oxygen. Minor (1-10%): NA. Trace (< 1%): NA. Area X-ray counts collected: 1,027,194. Live Time: 21.5 seconds. M... | 1 |
| 13:32, 4 January 2017 | 1 01 1 GypsumAlabaster EDS Spectrum.jpg (file) |  |
64 KB | EDS Spectrum showing elemental peak height as a function of X-ray counts collected (LC) Elements Identified Major (> 10%): oxygen, carbon, calcium, sulfur Minor (1-10%): NA Trace (< 1%): NA Area X-ray counts collected: 1,052,590 Live Time: 49.4 sec... | 1 |
| 09:39, 5 January 2017 | 1 01 15 GessodOro EDS Spectrum.jpg (file) |  |
65 KB | EDS Spectrum showing elemental peak height as a function of X-ray counts collected (LC) Elements Identified Major (> 10%): oxygen, carbon, calcium, sulfur Minor (1-10%): NA Trace (< 1%): NA Area X-ray counts collected: 1,018,003 Live Time: 35.8 sec... | 1 |
| 13:54, 6 February 2017 | 2 20 2 Hematite17A EDS Spectrum.jpg (file) |  |
65 KB | EDS Spectrum showing elemental peak height as a function of X-ray counts collected (LC) Elements Identified Major (> 10%): carbon, oxygen, calcium. Minor (1-10%): phosphorus, iron. Trace (< 1%): sulfur, silicon, potassium. Area X-ray counts collect... | 1 |
| 11:32, 31 January 2017 | 2 03 4 ViteBrucciaNero EDS Spectrum.jpg (file) |  |
65 KB | EDS Spectrum showing elemental peak height as a function of X-ray counts collected (LC) Elements Identified Major (> 10%): carbon, oxygen,calcium. Minor (1-10%): sulfur. Trace (< 1%): NA. Area X-ray counts collected: 1,010,653. Live Time: 17.4 seco... | 1 |
| 13:53, 4 January 2017 | 1 01 9 BoneAsh EDS Spectrum.jpg (file) |  |
65 KB | EDS Spectrum showing elemental peak height as a function of X-ray counts collected (LC) Elements Identified Major (> 10%): oxygen, carbon, calcium, phosphorus Minor (1-10%): NA Trace (< 1%): magnesium Area X-ray counts collected: 1,051,106 Live Tim... | 1 |
| 14:50, 4 January 2017 | 1 01 12 PlasterParis EDS Spectrum.jpg (file) |  |
66 KB | EDS Spectrum showing elemental peak height as a function of X-ray counts collected (LC) Elements Identified Major (> 10%): oxygen, carbon, calcium, sulfur Minor (1-10%): NA Trace (< 1%): magnesium Area X-ray counts collected: 1,017,125 Live Time: 3... | 1 |
| 15:30, 11 January 2017 | 1 09 10 TitaniumWhiteHatfield EDS Spectrum.jpg (file) | 67 KB | EDS Spectrum showing elemental peak height as a function of X-ray counts collected (LC) Elements Identified Major (> 10%): carbon, oxygen, titanium. Minor (1-10%): NA. Trace (< 1%): NA. Area X-ray counts collected: 1,024,473. Live Time: 49.6 second... | 1 | |
| 13:18, 17 January 2017 | 1 20 5 Kira42 EDS Spectrum.jpg (file) | 67 KB | EDS Spectrum showing elemental peak height as a function of X-ray counts collected (LC) Elements Identified Major (> 10%): oxygen, carbon, silicon, magnesium. Minor (1-10%): NA. Trace (< 1%): NA. Area X-ray counts collected: 1,022,797. Live Time: 5... | 1 | |
| 13:24, 10 January 2017 | 1 01 18 LimeWhite EDS Spectrum.jpg (file) |  |
67 KB | Elements Identified Major (> 10%): oxygen, carbon, calcium. Minor (1-10%): magnesium. Trace (< 1%): silicon. Area X-ray counts collected: 1,020,325. Live Time: 47.7 seconds. Magnification: 494x. Analyzed using Oxford X-Max80 energy-dispersive X-Ray s... | 1 |
| 11:30, 6 February 2017 | 2 07 2 BlueBlackWinsor EDS Spectrum.jpg (file) |  |
68 KB | EDS Spectrum showing elemental peak height as a function of X-ray counts collected (LC) Elements Identified Major (> 10%): copper, carbon, oxygen. Minor (1-10%): NA. Trace (< 1%): NA. Area X-ray counts collected: 1,008,409. Live Time: 11.1 seconds.... | 1 |
| 14:20, 12 January 2017 | 1 10 3 NoLabel EDS Spectrum.jpg (file) | 68 KB | EDS Spectrum showing elemental peak height as a function of X-ray counts collected (LC) Elements Identified Major (> 10%): oxygen, carbon, silicon, magnesium. Minor (1-10%): NA. Trace (< 1%): NA. Area X-ray counts collected: 1,047,913. Live Time: 4... | 1 | |
| 13:29, 6 February 2017 | 2 20 1 IwaKuraBurntMalachite EDS Spectrum.jpg (file) |  |
69 KB | EDS Spectrum showing elemental peak height as a function of X-ray counts collected (LC) Elements Identified Major (> 10%): iron, oxygen, carbon. Minor (1-10%): silicon. Trace (< 1%): aluminum, calcium, potassium. Area X-ray counts collected: 1,008,... | 1 |
| 10:50, 17 January 2017 | 1 20 3 GofunSeaShell EDS Spectrum.jpg (file) | 69 KB | EDS Spectrum showing elemental peak height as a function of X-ray counts collected (LC) Elements Identified Major (> 10%): oxygen, carbon, calcium. Minor (1-10%): NA. Trace (< 1%): sulfur. Area X-ray counts collected: 1,029,212. Live Time: 70.5 sec... | 1 | |
| 11:02, 17 January 2017 | 1 20 4 GofunOysterShell EDS Spectrum.jpg (file) | 69 KB | EDS Spectrum showing elemental peak height as a function of X-ray counts collected (LC) Elements Identified Major (> 10%): oxygen, carbon, calcium. Minor (1-10%): NA. Trace (< 1%): sulfur. Area X-ray counts collected: 1,028,594. Live Time: 66.0 sec... | 1 | |
| 15:11, 25 January 2017 | 2 01 8 LampblackTrimount EDS Spectrum.jpg (file) |  |
70 KB | EDS Spectrum showing elemental peak height as a function of X-ray counts collected (LC) Elements Identified Major (> 10%): carbon, oxygen, calcium. Minor (1-10%): phosphorus. Trace (< 1%): silicone, sodium, magnesium. Area X-ray counts collected: 1... | 1 |
| 14:24, 31 January 2017 | 2 03 5 NoirDeVigna EDS Spectrum.jpg (file) |  |
70 KB | EDS Spectrum showing elemental peak height as a function of X-ray counts collected (LC) Elements Identified Major (> 10%): carbon, oxygen, calcium. Minor (1-10%): phosphorus. Trace (< 1%): magnesium, sodium, silicon. Area X-ray counts collected: 1,... | 1 |
| 14:06, 11 January 2017 | 1 06 14 ZnO EDS Spectrum.jpg (file) | 71 KB | EDS Spectrum showing elemental peak height as a function of X-ray counts collected (LC) Elements Identified Major (> 10%): carbon, oxygen, zinc. Minor (1-10%): NA. Trace (< 1%): chlorine. Area X-ray counts collected: 1,016,534. Live Time: 31.2 seco... | 1 | |
| 09:46, 11 January 2017 | 1 06 7 GreenSeal EDS Spectrum.jpg (file) | 72 KB | EDS Spectrum showing elemental peak height as a function of X-ray counts collected (LC) Elements Identified Major (> 10%): carbon, oxygen, zinc. Minor (1-10%): NA. Trace (< 1%): chlorine. Area X-ray counts collected: 1,016,148. Live Time: 32.6 seco... | 1 | |
| 11:15, 11 January 2017 | 1 06 10 ZincOxideBaker EDS Spectrum.jpg (file) | 72 KB | EDS Spectrum showing elemental peak height as a function of X-ray counts collected (LC) Elements Identified Major (> 10%): zinc, oxygen, carbon. Minor (1-10%): NA. Trace (< 1%): chlorine. Area X-ray counts collected: 1,018,100. Live Time: 36.2 seco... | 1 | |
| 14:03, 17 January 2017 | 1 20 7 GofunOyster31 EDS Spectrum.jpg (file) | 72 KB | EDS Spectrum showing elemental peak height as a function of X-ray counts collected (LC) Elements Identified Major (> 10%): oxygen, carbon, calcium. Minor (1-10%): NA. Trace (< 1%): sodium, sulfur, silicon. Area X-ray counts collected: 1,022,313. Li... | 1 | |
| 10:53, 11 January 2017 | 1 06 9 ZincOxide EDS Spectrum.jpg (file) | 72 KB | EDS Spectrum showing elemental peak height as a function of X-ray counts collected (LC) Elements Identified Major (> 10%): carbon, zinc, oxygen. Minor (1-10%): NA. Trace (< 1%): chlorine. Area X-ray counts collected: 1,021,534. Live Time: 50.3 seco... | 1 | |
| 13:47, 11 January 2017 | 1 06 13 ZincWhite EDS Spectrum.jpg (file) | 72 KB | EDS Spectrum showing elemental peak height as a function of X-ray counts collected (LC) Elements Identified Major (> 10%): zinc, carbon, oxygen. Minor (1-10%): NA. Trace (< 1%): chlorine. Area X-ray counts collected: 1,024,582. Live Time: 58.3 seco... | 1 | |
| 13:34, 11 January 2017 | 1 06 12 OxideZinc EDS Spectrum.jpg (file) | 74 KB | EDS Spectrum showing elemental peak height as a function of X-ray counts collected (LC) Elements Identified Major (> 10%): zinc, carbon, oxygen. Minor (1-10%): NA. Trace (< 1%): chlorine. Area X-ray counts collected: 1,032,525. Live Time: 57.0 seco... | 1 | |
| 10:04, 6 February 2017 | 2 03 7 NeroDellaVigna EDS Spectrum.jpg (file) |  |
75 KB | EDS Spectrum showing elemental peak height as a function of X-ray counts collected (LC) Elements Identified Major (> 10%): carbon, oxygen, calcium. Minor (1-10%): phosphorus, iron. Trace (< 1%): sulfur, silicon, potassium, sodium. Area X-ray counts... | 1 |
| 15:21, 26 January 2017 | 2 02 7 IvoryBlackRoberson EDS Spectrum.jpg (file) |  |
76 KB | EDS Spectrum showing elemental peak height as a function of X-ray counts collected (LC) Elements Identified Major (> 10%): carbon, oxygen. Minor (1-10%): silicon, iron, aluminum, calcium, titanium. Trace (< 1%): magnesium, potassium, phosphorus, sul... | 1 |
| 10:09, 11 January 2017 | 1 06 8 PermanentChineseWhite EDS Spectrum.jpg (file) | 77 KB | EDS Spectrum showing elemental peak height as a function of X-ray counts collected (LC) Elements Identified Major (> 10%): zinc, oxygen, carbon. Minor (1-10%): chlorine. Trace (< 1%): silicon. Area X-ray counts collected: 1,025,032. Live Time: 42.7... | 1 | |
| 13:54, 12 January 2017 | 1 10 2 WhiteSpain EDS Spectrum.jpg (file) | 78 KB | EDS Spectrum showing elemental peak height as a function of X-ray counts collected (LC) Elements Identified Major (> 10%): barium, oxygen, nitrogen. Minor (1-10%): carbon. Trace (< 1%): NA. Area X-ray counts collected: 1,036,309. Live Time: 90.7 se... | 1 | |
| 15:08, 12 January 2017 | 1 20 2 Kiara EDS Spectrum.jpg (file) | 78 KB | EDS Spectrum showing elemental peak height as a function of X-ray counts collected (LC) Elements Identified Major (> 10%): oxygen, silicon, carbon, aluminum. Minor (1-10%): potassium, iron, magnesium. Trace (< 1%): sodium. Area X-ray counts collect... | 1 | |
| 12:01, 11 January 2017 | 1 06 11 ZincWhiteWinsorNewton EDS Spectrum.jpg (file) | 79 KB | EDS Spectrum showing elemental peak height as a function of X-ray counts collected (LC) Elements Identified Major (> 10%): carbon, oxygen, zinc. Minor (1-10%): NA. Trace (< 1%): chlorine, barium, titanium, sulfur. Area X-ray counts collected: 1,022... | 1 | |
| 09:38, 6 February 2017 | 2 03 6 Noir EDS Spectrum.jpg (file) |  |
80 KB | EDS Spectrum showing elemental peak height as a function of X-ray counts collected (LC) Elements Identified Major (> 10%): carbon, oxygen. Minor (1-10%): silicon, iron, aluminum, calcium, titanium. Trace (< 1%): magnesium, potassium, sulfur, phospho... | 1 |
| 13:52, 25 January 2017 | 2 01 6 Tierra Negra EDS Spectrum.jpg (file) | 82 KB | EDS Spectrum showing elemental peak height as a function of X-ray counts collected (LC) Elements Identified Major (> 10%): carbon, oxygen, silicon. Minor (1-10%): aluminum, iron, potassium. Trace (< 1%): calcium, magnesium, phosphorus, titanium, sul... | 1 | |
| 13:33, 12 January 2017 | 1 09 11 DryTitaneoc EDS Spectrum.jpg (file) | 82 KB | EDS Spectrum showing elemental peak height as a function of X-ray counts collected (LC) Elements Identified Major (> 10%): barium, oxygen, carbon, titanium. Minor (1-10%): sulfur. Trace (< 1%): NA. Area X-ray counts collected: 1,030,389. Live Time:... | 1 | |
| 15:16, 11 January 2017 | 1 07 4 Lithopone EDS Spectrum.jpg (file) | 85 KB | EDS Spectrum showing elemental peak height as a function of X-ray counts collected (LC) Elements Identified Major (> 10%): carbon, oxygen, barium. Minor (1-10%): zinc, sulfur. Trace (< 1%): silicon. Area X-ray counts collected: 1,021,143. Live Time... | 1 | |
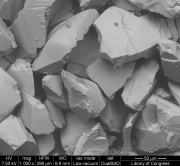
| 13:42, 17 January 2017 | 1 20 6 Suisho SEM 50um.jpg (file) |  |
411 KB | SEM image with 50µm measurement bar (approximate to 1000x magnification) (LC) Imaged with FEI Quanta 600 scanning electron microscope (SEM) and xT microscope Server user interface. Pigment sample was applied to carbon tape and mounted onto aluminum e... | 1 |
| 15:05, 12 January 2017 | 1 20 2 Kiara SEM 50um.jpg (file) |  |
416 KB | SEM image with 50µm measurement bar (approximate to 1000x magnification) (LC) Imaged with FEI Quanta 600 scanning electron microscope (SEM) and xT microscope Server user interface. Pigment sample was applied to carbon tape and mounted onto aluminum e... | 1 |
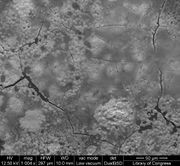
| 09:44, 11 January 2017 | 1 06 7 GreenSeal SEM 50um.jpg (file) |  |
430 KB | SEM image with 50µm measurement bar (approximate to 1000x magnification) (LC) Imaged with FEI Quanta 600 scanning electron microscope (SEM) and xT microscope Server user interface. Pigment sample was applied to carbon tape and mounted onto aluminum e... | 1 |
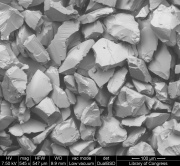
| 13:41, 17 January 2017 | 1 20 6 Suisho SEM 100um.jpg (file) |  |
432 KB | SEM image with 100µm measurement bar (approximate to 500x magnification) (LC) Imaged with FEI Quanta 600 scanning electron microscope (SEM) and xT microscope Server user interface. Pigment sample was applied to carbon tape and mounted onto aluminum e... | 1 |