Difference between revisions of "More on the data"
| Line 45: | Line 45: | ||
Some of the yellows in ''ukiyo-e'' prints also fluoresce. For example, the strongly-fluorescing turmeric is easily identifiable by EEM. However, other organic yellow colorants such as Japanese pagoda tree (''enju'') and gardenia (''kuchinashi''), which belong to a general chemical class known as flavonoids, exhibit relatively little fluorescence, and while their presence can be hypothesized by EEM, they are impossible to differentiate from one another. | Some of the yellows in ''ukiyo-e'' prints also fluoresce. For example, the strongly-fluorescing turmeric is easily identifiable by EEM. However, other organic yellow colorants such as Japanese pagoda tree (''enju'') and gardenia (''kuchinashi''), which belong to a general chemical class known as flavonoids, exhibit relatively little fluorescence, and while their presence can be hypothesized by EEM, they are impossible to differentiate from one another. | ||
| + | <br> | ||
[[EEM analysis of Ukiyo-e prints|More info]] | [[EEM analysis of Ukiyo-e prints|More info]] | ||
| − | |||
| − | |||
==What is FORS?== | ==What is FORS?== | ||
Revision as of 07:03, 25 April 2025

Visual inspection of each print was carried out, as well as examination under ultraviolet illumination followed by examination of one or more non-invasive analytical techniques. These techniques were used to were used to 'identify' the colorants based on their physical and chemical characteristics. The techniques included: X-ray fluorescence spectroscopy (XRF), excitation emission matrix fluorescence spectrophotometry (EEM), fiber optics reflectance spectroscopy (FORS), and in some instances reflectance imaging spectroscopy (RIS). Reference samples for each of the colorants as well as the mixtures were formulated and printed using organic and inorganic materials traditionally believed to have been used during the Edo period (1603–1868). It is important to note that this database contains our hypothetical identifications of the colorants for locations within each given print, but strictly speaking, we cannot provide certain identifications since no samples were removed. This database is meant to be a beginning point for continuing targeted research on the specific types of colorants found in Edo period Japanese prints.
Analytical Procedures
This section provides an overview of the individual analytical techniques. The 'More Details pages for specific analysis provide additional information on instrument parameters, data interpretation and potential limitations in the accuracies of the identifications. Our strategy included the following optimum process for the examination of each print.
Examination and Photography
- Visible: Overall examination and documentation of the condition of the print, the colors and the printing processes (e.g., color mixtures and overprinting)
- UV light: Fluorescent/absorption documentation, i.e., safflower fluoresces brightly while gamboge does not.
- Infrared Reflectography: Reflectance /absorption documentation, i.e. carbon black absorbs completely.
Non Destructive Analytical procedures
- Optical Microscopy: to assess condition, paint layers, particles, etc.
- X-ray Fluorescence: elemental analysis can indicate some components, i.e., Hg for vermilion.
- FORS: Visible light reflection measurements help with some colorants, often organic ones that XRF cannot detect
- EEM: can often identify compounds that fluoresce
- FTIR-reflected: help when mixtures are present
- RAMAN: identifies crystalline compounds
What is XRF?


|
| XRF spectrum of yellow area exhibiting major Arsenic peak |
X-ray fluorescence (XRF) spectroscopy is a nondestructive analytical method used to determine the elemental composition of materials. When excited by X-rays, each element emits secondary or fluorescent X-rays that have energies unique to the element. The XRF instrument used in this research, a Bruker Artax micro-XRF spectrometer, cannot detect elements lighter than silicon, thus organic colorants (which mainly consist of carbon, oxygen, and hydrogen) cannot be identified.
For this database, XRF was used to tentatively identify inorganic colorants and metals based on the element(s) detected. For example, if XRF detects the elements arsenic and sulfur in a yellow area, the pigment is most likely to be orpiment (arsenic trisulfide), the most common natural yellow colorant that contains arsenic. While chemical elements can suggest specific pigments, from a scientific point of view other techniques not yet used in this study are required to identify pigments with certainty (such as Raman spectroscopy or X-ray diffraction). In the case of yellows that contain arsenic, orpiment is the most likely pigment, but there are two other possibilities. In the later part of the Edo Period, a synthetic pigment of the same chemical composition was manufactured, and this artificial pigment cannot be distinguished from the natural mineral by XRF alone. More info
What is EEM?


|
| Excitation and emission maxima of the three red colorants |

|
| 3D EEM plots of reds |
Some organic colorants used in Japanese woodblock prints can be characterize based on their ability to fluoresce when exposed to ultraviolet (and even visible) illumination. Excitation emission matrix (EEM) fluorescence spectrophotometry measures emission (fluorescence) of a material (in the visible range) as a function of the wavelength to which the material is exposed (in the ultraviolet as well as visible range). The typical display of results is a color contour map with excitation wavelength on the y-axis and emission wavelength on the x-axis. These maps can allow for (at least tentative) identification of some materials if the contour maps are visibly different for each of the potential materials. Even the lack of fluorescence, which indicates the material is non-fluorescent, may provide a key piece of information for identification of certain colorants. For this research, an Agilent Cary Eclipse Spectrometer with a fiber optic probe was used.
The excitation and emission maxima of the red colorants, safflower, madder, and sappanwood are similar but not identical (see left). The emission maxima for safflower is in the yellow-orange region, madder is in the orange region, and sappanwood is in the orange-red region. (Viewing these colorants side by side under ultraviolet illumination would show the subtle differences in tone.) The relative intensity of the absorption or emission is indicated by the color with dark red representing highest intensity. The oblique bar on the plot is where the excitation and emission wavelengths are identical, thus the detector is saturated at these points.
Some of the yellows in ukiyo-e prints also fluoresce. For example, the strongly-fluorescing turmeric is easily identifiable by EEM. However, other organic yellow colorants such as Japanese pagoda tree (enju) and gardenia (kuchinashi), which belong to a general chemical class known as flavonoids, exhibit relatively little fluorescence, and while their presence can be hypothesized by EEM, they are impossible to differentiate from one another.
More info
What is FORS?


|
| FORS spectra blues |
Fiber Optics Reflectance spectroscopy (FORS) measures the reflectance of a point on an object across the visible and near infrared region (about 400-1000 nm). FORS uses a fiber optic probe and a high intensity halogen light source to examine very small spots, minimizing the interference from ambient light. For this research, an Ocean Optics miniature spectrometer was used.
Reflectance spectra can distinguish between some colorants. For example, the three common blue colorants used in Japanese woodblock prints (dayflower, indigo, and Prussian blue) can be easily identified by FORS. Greens were usually made from a combination of a blue and a yellow colorant, while purples were usually made from a combination of a blue and a red colorant. The blue colorants in these mixtures can usually be determined by FORS analysis. FORS is not usually useful for identifying yellow colorants, but can sometimes be useful for the organic reds. More info
What is RIS?
While FORS measures reflectance at a spot, Reflected Image Spectroscopy (RIS) provides a reflectance map across a selected region, which could include an entire print. The RIS data consists of individual spectra recorded at adjoining points that are usually well under 0.1 mm in diameter. The instrument used here is a Nerios HERA visible/near infrared hyperspectral camera (measuring in the 400-1000 nm range). RIS data are typically evaluated by highlighting areas of the object that was scanned which show identical or very close to identical reflectance spectra. Thus, the data can be a means of indicating where a specific colorant is present over an entire print. For example, the images below show where different colors are distributed in one print. More info

RGB projection of hyperspectral data
MFA# 11.30331
RIS points similar to yellow selection
MFA# 11.30331
RIS points spectrally similar to blue 1 selection
MFA# 11.30331
RIS points spectrally similar to blue 2 selection
MFA# 11.30331
RIS points spectrally similar to pink selection (safflower)
MFA# 11.30331
RIS points spectrally similar to red selection (madder)
MFA# 11.30331


How to look at the results
The results presented in this database are based on the three (or sometimes four) methods mentioned described above. XRF was run on all data points, but FORS and EEM were utilized according to the visual color, as well as speculated (original) color if fading or other alteration is suspected to have occurred. For example, FORS was run where blue was speculated (i.e. blues, greens, purples, and faded variations), but would not have typically been run on yellows or reds. Also, at this time other analytical or photographic methods that can also aid in the identification of colorants have not been used. Therefore, the results are not all-encompassing and/or definitive.
Results
Shown below is an example of the tables that occur on eah of the print pages. These table include images of the analysis locations as well as a list of the techniques and their resultant interpretations.
| Analysis point | Image | Method | Results |
|---|---|---|---|
| Pt 1 |  |
XRF | orpiment (EEM to be run) |
| Pt 2 |  |
XRF, EEM | inconclusive |
| Pt 3 |  |
XRF, EEM | orpiment, turmeric |
| Pt 4 |  |
XRF, EEM | safflower (FORS to be run) |
| Pt 5 |  |
XRF, FORS | indigo |
Tabular information:
- Analysis point: Each point corresponds to its circle on the print image, which is where the data was collected using the specified analytical methods.
- Image: This is a 10x image collected by the XRF spectrometer that shows the region of analysis.
- Method: This indicates which analytical methods were used on the region of analysis.
- Results:
-The colorants are interpreted from the collected data in conjunction with visual inspection. For example, if arsenic is detected in a yellow area, it is interpreted as orpiment (arsenic trisulfide).
- -If more than one colorant is identified, they are listed in alphabetical order.
- -"Inconclusive" indicates that the data collected was not conclusive enough to identify a colorant.
- -The additional comment, for example in Pt 1 and Pt 4, indicates that the specified analytical method is scheduled to be conducted in the future. Additionally, Pt 4 is visually a purple color which suggests that it was most likely created from a red and blue colorant but only a red color is listed. This is because FORS which is used to identify blue colorants has not be run; hence the comment, (FORS to be run). If FORS is run in the future and a blue colorant is identified, the result will be updated, but if a blue colorant cannot be identified, the result will only reflect the identified colorant, safflower. For more detail, please see "faded colors" below.
Raw data
The below spectra and pattern are examples of the raw data collected by each analytical method. These data are interpreted by conservation scientists experienced in the particular analytical technique to identify the colorant. As such, only the interpreted results, not the raw data, are given for each print.
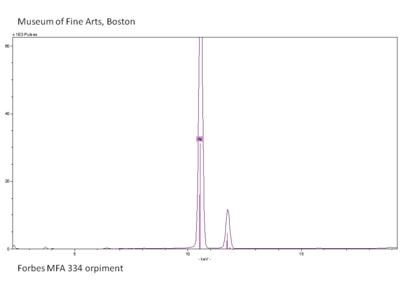
XRF spectrum of Orpiment 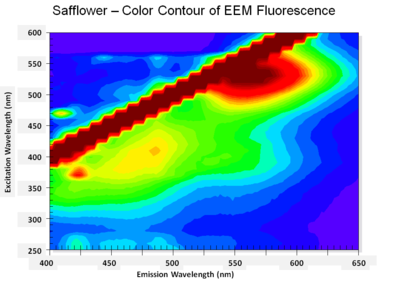
3D EEM pattern of Safflower 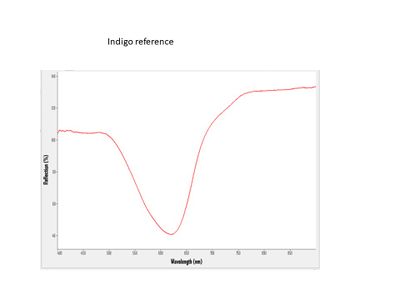
FORS spectrum of Indigo


What colors are difficult to identify?
- Faded colors are a challenge and at times not all colors can be fully detected. Although visual observation may give a clue to the colorant or colorants present, only the results from the analytical methods are given. Therefore, if only one colorant of a mixture/overprinting was detected although visually the color is identifiable as a mixture/overprinting, only the detected color is presented in the results. In most cases, XRF, EEM, and FORS still pick up faded colors, but all three techniques are restricted by their detection limits as well as the presence of any fillers and fluorescence in the paper itself.
- Flavonoids are also a challenge. This group of organic yellow colorants containing flavonoids cannot be reliably distinguished from one another with the three analytical methods used in this research. While FTIR reflection spectroscopy has been used to differentiate the flavonoids (see Bibliography) this analytical method was not often carried out for this research.
Dayflower which can shift to a greenish blue, yellow, or tan, also has a similar EEM fluorescence to the flavonoids once it discolors. Luckily, most times the presence of dayflower can be visually distinguished from the other flavonoids and/or FORS analysis can still detect its presence.
- Red lead/lead white is a combination which is often listed, based on the XRF identification of the element lead and the visual coloration of 'pink' in the region. Further studies using reflected FTIR or Raman would be needed to better characterize this mixture.
- Carbon black cannot de easily detected by the three non-invasive techniques used above. Infrared reflected light is most commonly used, but this examination was not always implemented. Therefore, carbon black used as a color (black, gray, or blue gray) or mixed with another color is not identified in this database.
- Orpiment can have different structural forms due to the way it is prepared; directly by grinding the mineral orpiment (natural orpiment) or by heat treating to create a mixture of crystalline and amorphorus form (processed orpiment), and synthetic orpiment. The mineral orpiment and synthetic orpiment both have been found in ukiyo-e prints (see Bibliography). The identification of these different structural forms of orpiment requires the use of Raman spectroscopy which was not often used for this research.
- Mica While XRF spectroscopy along with visual inspection is used to determine the presence of mica.
- Gamboge has been listed when a yellow colored region is non-fluorescent and its XRF spectrum does not show the presence of arsenic (indicating orpiment) or iron (indicating iron oxide yellow). In some cases, inspection of the region clearly showed a shiny resinous appearance that implicated gamboge, but this was not always the case.
Japanese terms for color and materials
Throughout history, many of the colors and materials have had multiple names and still may have multiple names associated with them. For this database, we have tried to use the most common currently-used name for the raw material used to produce the color. For example, orpiment (石黄) sekiō is also commonly called kiō. It has also been called yūō (雄黄) which is actually the Chinese word for realgar, while the Chinese term for orpiment, 雌黄 (shiō in Japanese) has been also used to describe orpiment as well as gamboge.