More on the data

Visual inspection of each print was carried out under a stereobinocular microscope, as well as examination under ultraviolet illumination using a handheld ultraviolet lamp. Based on these observations, points were chosen for analysis by one or more non-invasive techniques. Typically, less than a dozen points on a given print were analyzed, with points chosen to include all colorants or mixtures of colorants visible in the print. Reference samples for each of the colorants (for example, fig.1) as well as the mixtures were formulated and printed using organic and inorganic materials traditionally believed to have been used during the Edo period (1603–1868). [[1][2]]. Near the end of the Edo period, synthetic organic pigments (or dyes) first became available to woodblock printers [[3]]. In the rare instances that any of these colorants were suspected, they have been tentatively identified using previously published data rather than lab standards.
This database contains hypothetical identifications of the colorants in each print, but strictly speaking identifications are not certain since no samples were removed for unequivocal characterization. As a result of the limited number of points analyzed on a given print, the results may not include all colorants that are actually present in the print. Two (perhaps even more) colorants were sometimes mixed together, and other times, one colorant was overprinted onto another. Combinations of colorants can be challenging to characterize. This database is intended to be a beginning point for continuing targeted research on the specific types of colorants found in Edo period Japanese prints.
Woodblock prints were a type of mass medium, and a given print exists in many copies, beginning with those from the initial printing, often followed by numerous later printings from the original blocks, or even prints from later, newly carved blocks. Most often, in this database, only single prints were examined, and the relationship of the particular print examined to other versions of the same print has not been explored. [[4][5]]
Non-invasive and analytical procedures
The examinations included in this database were carried out over a period of years, with some prints being examined more than once. The core analytical techniques, described in more detail below, were X-ray fluorescence spectrometry (XRF), fiber optics reflectance spectroscopy (FORS), and fluorescence spectrometry (specifically, excitation-emission matrix, or EEM, fluorescence spectrometry). All analyses of a given type were carried out with the same instrument. A few prints have also been examined with a hyperspectral camera (reflectance imaging spectroscopy, or RIS). In the following sections, each analytical technique is described, with an example of data from the technique. More detailed information on each technique and its limitations can be accessed by the “more info” link in each section.
What is XRF?


|
| Bruker Artax XRF open architecture instrument |
X-ray fluorescence spectroscopy (XRF) determines the elemental composition of materials. When excited by X-rays, nearly all elements emit secondary or fluorescent X-rays that have energies unique to the element. The XRF instrument used in this research, a Bruker Artax µ-XRF spectrometer (fig.2), cannot detect elements lighter than silicon, thus organic colorants (which mainly consist of carbon, oxygen, and hydrogen) cannot be characterized.
XRF was used to tentatively identify inorganic colorants and metals based on the element(s) detected. For example, if XRF detects the elements arsenic and sulfur in a yellow area (fig.3), the pigment is most likely to be orpiment (arsenic trisulfide), the most common natural yellow colorant that contains arsenic. While chemical elements can suggest specific pigments, from a scientific point of view other techniques not used in this study are required to identify pigments with certainty (such as Raman spectroscopy or X-ray diffraction).
More info
What is EEM?


|
| Figure 4. Agilent Cary Eclipse fluorescence spectrophotometer with a fiber optic probe |
Some red and yellow organic colorants used in Japanese woodblock prints can be characterized based on their ability to fluoresce when exposed to ultraviolet (and even visible) illumination. Excitation-emission matrix fluorescence spectrometry (EEM) measures emission (fluorescence) of a material (in the visible range of the electromagnetic spectrum) as a function of the wavelength to which the material is exposed (in the ultraviolet as well as visible range). Results are typically displayed as color contour maps, with excitation wavelength on the y-axis and emission wavelength on the x-axis. These maps can allow for (at least tentative) identification of fluorescent materials if the contour maps are visibly different for each potential material. Even the lack of fluorescence may provide a key piece of information for identification of certain colorants. For this research, an Agilent Cary Eclipse fluorescence spectrophotometer with an external fiber optic probe was used. EEM maps always show an oblique line at which excitation and emission wavelengths are identical, saturating the detector. The regions of strongest fluorescence and maximum excitation are red, areas of weakest detectable fluorescence and excitation are light blue. Colors in a given plot are a function of the fluorescence of a given material as well as the setting of the detector for the specific analysis.
The example in fig. 5 a-c shows some of the EEM measurements from MFA 11.13642, an 1811 print by Utagawa Toyokuni I. The fluorescence of the pale pink banner (fig.5b) is at its maximum excitation wavelength of about 530nm and emission wavelength of about 560nm, typical of safflower.
Some of the yellows in ukiyo-e prints also fluoresce. The strongly-fluorescing turmeric is easily identifiable by EEM (see fig 5c). However, other organic yellow colorants such as Japanese pagoda tree (enju) and gardenia (kuchinashi), which belong to a general chemical class known as flavonoids, exhibit relatively little fluorescence, and while their presence can be hypothesized by EEM, they are impossible to differentiate from one another. More info
What is FORS?


|
| Figure 6. Ocean Optics visible/ near infrared spectrometer, light source and fiber optics probe. |
Fiber Optics Reflectance spectroscopy (FORS), of the type used in compiling this database, records reflectance of a point on an object across the visible and near infrared region (about 400-1000 nm). For this research, an Ocean Optics miniature spectrometer was used (fig.6). Spectra are often plotted using a white tile reference. This permits ready comparison of spectra acquired from similar but not identical equipment. For our research, an area of bare paper from the print was used as reference. The spectra will not be identical in shape to those acquired using a white tile reference since the paper usually has a slight yellowish or beige tint.
Reflectance spectra can distinguish between some colorants, most notably the three common blue colorants used in Japanese woodblock prints (dayflower, indigo, and Prussian blue; see fig. 7). Mixtures of Prussian blue and indigo, used in regions of some late Edo prints, can also be identified. Greens were usually made from a combination of a blue and a yellow colorant, while purples were usually made from a combination of a blue and a red colorant. The blue colorants in these mixtures can usually be determined by FORS analysis. FORS is not usually useful for identifying yellow colorants but can sometimes be useful for the organic reds.
More info
What is RIS?


|
| Figure 8. Nireos HERA visible/ near infrared hyperspectral camera and lights. |
While FORS measures reflectance at a spot, reflectance imaging spectroscopy (RIS) provides a map of reflectance across a selected region, which could include an entire print. The RIS data, acquired with a hyperspectral camera, consists of individual spectra recorded at adjoining points that are usually well under 0.1 mm in diameter. The instrument used here is Nireos HERA visible/near infrared hyperspectral camera (measuring in the 400-1000 nm range).
RIS data are typically evaluated by highlighting areas of the object that was scanned which show identical or very close to identical reflectance spectra. Thus, the data can be a means of indicating where a specific colorant is present over an entire print. For the example in Fig.9, the image at right shows that all the yellows in this print are identical in composition. An actual colorant identification can be tentatively made by comparing spectra from the object with those in a reference library.
How to look at the results
The results presented in this database for a specific print are based on the three (or sometimes four) methods described above. XRF was run on all data points, FORS and EEM were utilized according to the color, as well as speculated (original) color if fading or other alteration is suspected to have occurred. As an example of the latter, FORS was carried out where blue was speculated (i.e. blues, greens, purples, and faded variations), but FORS typically would not be carried out on yellows or reds. RIS has only been carried out on some prints, and, when used in conjunction with XRF and EEM data, it may provide a more certain view of the distribution of specific colorants or mixtures of colorants in a print than can the point analyses. There are some other non-invasive techniques or minimally invasive techniques (requiring very small samples) that have been used in published studies of Japanese prints which can provide more certainty in colorant identifications.
Results
Shown below is an example of the tables that occur on each of the print pages.
| Analysis point | Image | Method | Results |
|---|---|---|---|
| Pt 1 | 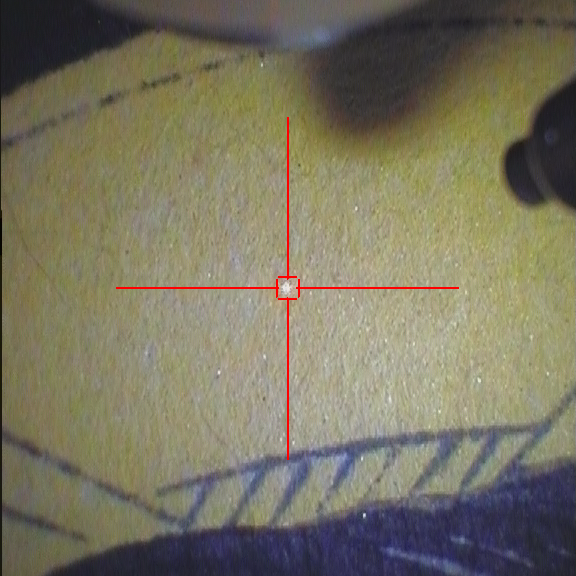 |
XRF | orpiment (EEM to be run) |
| Pt 2 | 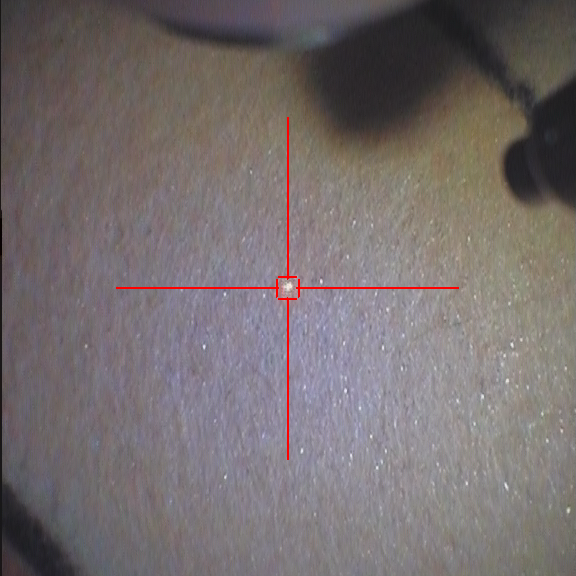 |
XRF, EEM | inconclusive |
| Pt 3 | 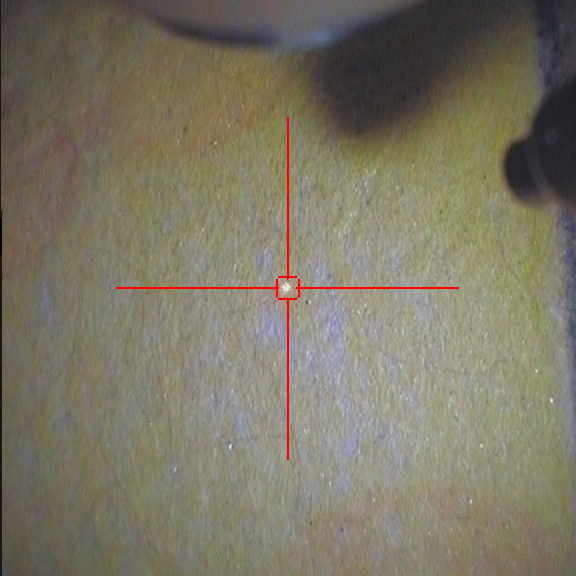 |
XRF, EEM | orpiment, turmeric |
| Pt 4 | 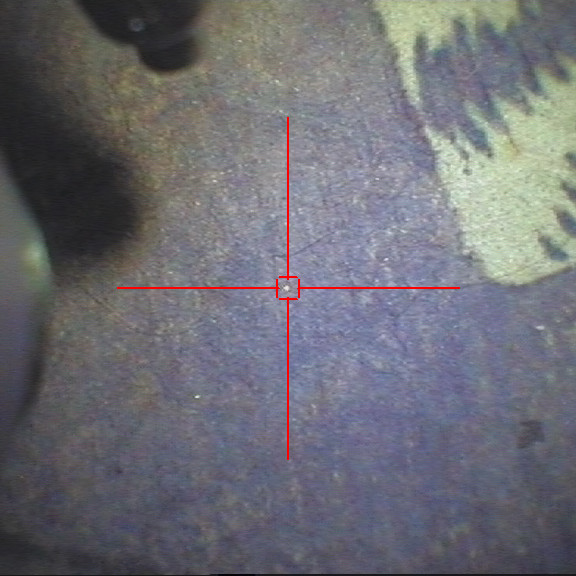 |
XRF, EEM | safflower (FORS to be run) |
| Pt 5 | 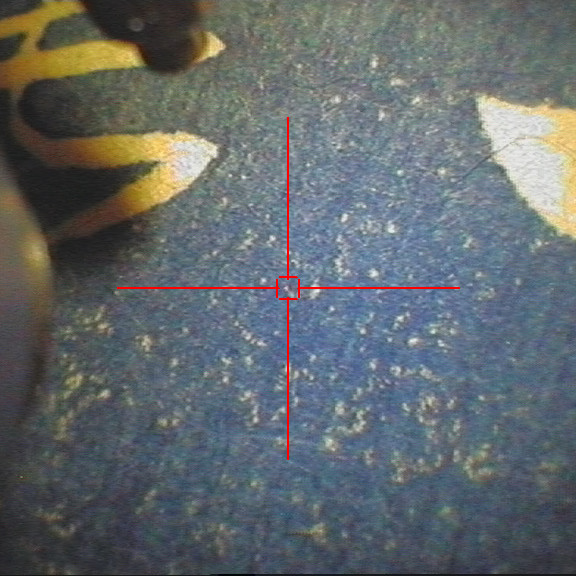 |
XRF, FORS | indigo |
Tabular information:
- Analysis point: Each point corresponds to its circle on the print image where the data was collected using the specified analytical methods.
- Image: This is a 10x image collected by the XRF spectrometer that shows the region of analysis.
- Method: This indicates which analytical methods were used on the region of analysis.
- Results: The colorants are listed in alphabetical order if more than one was present at a point. Identifications are based on visual examination and analyses, but are in many instances hypothetical and cannot be considered definitive. "Inconclusive" indicates that the data collected could not be used to hypothesize colorants. In some cases, additional analysis is planned, as indicated in the “results” column.
What colors are difficult to identify?
- Faded colors present a challenge. Although visual observation may give a clue to the colorant or colorants in such regions, only the results from the analytical methods are given. Therefore, if only one colorant of a mixture/overprinting was detected although visually the color is identifiable as a mixture/overprinting, only the detected color is presented in the results. In most cases, XRF, EEM, and FORS may provide useful information on faded colorants, but all three techniques are restricted by their detection limits.
- The group of organic yellow colorants containing Flavonoids cannot be reliably distinguished from one another with the three analytical methods used in this research.
- As a result of degradation, Dayflower can shift to a greenish blue, yellow, or tan. Fortunately, faded dayflower can usually be visually distinguished from flavonoids, which may have a similar color, and often FORS analysis can still detect its presence.
- Red lead/Lead white is a combination which is often listed, based on the XRF identification of the element lead and the visual coloration of 'pink' in the region.
- Carbon black cannot de easily detected by the three non-invasive techniques used above. Carbon black used as a color (black, gray, or blue gray) or mixed with another color is not identified in this database.
- Identifications of Orpiment in yellow areas may not be correct, as there are other yellow arsenic sulfides that could be present instead of or in addition to orpiment, but these cannot be distinguished through the analytical techniques used to compile this database.
- Mica is surmised based on its visual appearance as well as its XRF spectrum.
- Gamboge has been listed when a yellow-colored region is non-fluorescent and its XRF spectrum does not show the presence of arsenic (indicating orpiment) or iron (indicating iron oxide yellow). In some cases, inspection of the region clearly showed a shiny resinous appearance that implicated gamboge, but this was not always the case.
Japanese terms for color and materials
Throughout history, many of the colors and materials have had multiple names and still may have multiple names associated with them. For example, orpiment (石黄) sekiō is also commonly called kiō. It has also been called yūō (雄黄) which is actually the Chinese word for realgar, while the Chinese term for orpiment, 雌黄 (shiō in Japanese) has been also used to describe orpiment as well as gamboge.
In the database tables, the most commonly-used English names for the colorants are used. On the pages that discuss individual colorants, nomenclature is described in more detail, including Japanese terminology.
Citations
- ↑ * 1. Michele Derrick, Richard Newman, and Joan Wright, "Characterization of Yellow and Red Natural Organic Colorants on Japanese Woodblock Prints by EEM Fluorescence Spectroscopy" in JAIC, 2017 Link
- ↑ * 2. Michele Derrick, Joan Wright, and Richard Newman, "Plant Dye Identification in Japanese Woodblock prints" in Arnoldia 74/3, February 2017. Link
- ↑ * 3. Anna Cesaratto, Yan-Bing Lueo, Henry D. Smith II, and Marco Leona, 'A timeline for the introduction of synthetic dyestuffs in Japan during the late Edo and Meiji periods', Heritage Science 6, 22 (2018) Link
- ↑ * 4. Capucine Korenberg, Michele Derrick, Lucía Pereira Pardo, and Ryoko Matsuba, 'Establishing the production chronology of the iconic Japanese woodblock print ‘Red Fuji’', 2021 Link
- ↑ *5. Marc Vermeulen, Lucia Burgio, Nathalie Vandeperre, Elyse Driscoll, Madeleine Viljoen, Janie Woo, and Marco Leona, ‘Beyond the connoisseurship approach: creating a chronology in Hokusai prints using non-invasive techniques and multivariate data analysis,’ Heritage Science 8, 62 (2020).