More on the data

For this research non-invasive, non-destructive techniques that do not require sampling from the prints were used to analyze the colorants. The analytical techniques used are X-ray Fluorescence (XRF), Excitation Emission Matrix (EEM), and Fiber Optic Reflectance (FORS) spectroscopies. Colorant samples were also formulated and printed using organic and inorganic materials traditionally believed to have been used during the Edo period (1603–1868). These were used to cross reference the analytical results. These methods, in conjunction with visual inspection, were then used to identify the colorants.
Analytical Methods
What is XRF?


X-ray fluorescence (XRF) is a nondestructive analytical method used to qualitatively and semi-quantitatively determine the elemental content of materials. The x-ray spectrum emitted from each element has a unique set of energies that are related to the type and number of atoms present in the sample. For this research, ARTAX open-architecture instrument was used.
XRF is used to identify inorganic colorants based on their inorganic element composition. For example, orpiment can be identified using XRF because it can detect the arsenic in orpiment, which is an arsenic trisulfide. In combination with visual inspection (yellow color) it can be identified as orpiment because it is the only known yellow colorant with arsenic.
Since most XRF cannot detect atomic elements below calcium (i.e. all elements with a smaller atomic number than calcium on the periodic table), it cannot aid in the identification of organic colorants.
What is EEM?


Excitation Emission Matrix (EEM) is a spectroscopy method that results in a 3D pattern of the fluorescence of an organic material. The pattern is produced by plotting the intensity of a sample’s fluorescence emissions occurring as a series of stepped excitation wavelengths. Each material has a reproducible 3D fluorescence pattern that allows its identification. Even the lack of fluorescence, which indicates the material is non-fluorescent, also provides a key piece of information for identification of a colorant. The reference colorant samples were printed to create a set of baseline patterns for each colorant.
The MFA uses an Agilent Cary Eclipse Spectrometer with a fiber optic probe to identify some organic yellow and and most red colorants on the Japanese prints. Excitation can occur at many wavelengths. When we set the instrument to scan through several excitation wavelengths, we can determine which wavelength excites the most molecules to fluoresce. This is called the Excitation maxima. (safflower, madder, sappanwood). Exposing the compound to this maximum excitation wavelength we can measure the emission curve. And the point with the highest emission is called the Emission max. (safflower, madder, sappanwood). As you can see for these three reds, their Excitation and Emission maxima are distinctly different. Thus these three reds can be distinguished by their fluorescence measurements. Also we can see from these maxima that the emission for safflower is in the yellow-orange region, madder is in the orange region and sappanwood is in the orange-red region. With the Japanese prints, during the Edo period, there was a specific set of colorants that were used. In out experience, it has been easiest for identify the reds, even in mixtures, when the spectral data is shown as a 3-dimensional plot where the excitation wavelength is given on the vertical axis and the emission wavelength on the horizontal access. The intensity of the absorption or emission is given by the color with dark red being the most intense. The angled bar on the plot is where the excitation and emission wavelengths are identical, thus the detector is saturated at these points. Shown here are the patterns for safflower, madder and sappanwood and you can easily see that each is distinct.
Additionally some of the yellow in the Japanese prints also fluoresce. For example, turmeric has a unique fluorescence or EEM pattern, making it an easily identifiable colorant using EEM. However, some of the other organic yellow colorants that were used, such as pagoda tree and eulalia belong to a general chemical class know as flavonoids. the EEM spectra for these are difficult to reliably differentiate.
What is FORS?

Fiber Optics Reflectance spectroscopy (FORS) is a non-invasive technique that can be used for the examination of color as well as for the identification of colorants. FORS uses a fiber optic probe and a pulsed xenon source to provide good sensitivity, examine small areas, and minimize the interference from ambient light. For this research, an Ocean Optics miniature spectrometer was used.
FORS is able to distinguish between the three common blue colorants used in Japanese woodblock prints: dayflower, indigo, and Prussian blue. This can be accomplished, not only in blue printed areas, but also in greens and purples, which are a combination of a blue and another colorant (yellow, red). FORS is not useful in identifying yellow or red organic colorants.
How to look at the results
The results presented in this database are based on the three analytical methods mentioned above: XRF, FORS, and EEM. XRF was run on all data points, but FORS and EEM were utilized according to the visual color as well as speculated color. For example, FORS was run where blue was speculated (i.e. blues, greens, purples, and faded variations), but would not have been run on yellows or reds. Also, at this time other analytical or photographic methods that can also aid in the identification of colorants have not been used. Therefore, the results are not all-encompassing and/or definitive.
Results
Example:
- Analysis point: Each point corresponds to its circle on the print image, which is where the data was collected using the specified analytical methods.
- Image: This is a 10x image collected by the XRF spectrometer that shows the region of analysis.
- Method: This indicates which analytical methods were used on the region of analysis.
- Result: The colorants are interpreted from the collected data in conjunction with visual inspection. If more than one colorant is identified, they are listed in alphabetical order. "Inconclusive" indicates that the data collected was not conclusive enough to identify the colorant. Any comment in the column, such as Pt 1 and Pt 4 on the left, indicates the specified analytical method is scheduled to be done in the future. For example, Pt 4 visibly is a purple color, thus indicating it is most likely prepared with a combination of red and blue colorants. However, only a red color is listed because the FORS technique that is used to identify the blue colorant has not be run; hence the comment, (FORS to be run). If FORS is done in the future and a blue colorant is identified, the result will be updated, but if a blue colorant cannot be identified, the result will only reflect the identified colorant, safflower. For more detail, please see "faded colors" below.
Raw data
The below spectra and pattern are examples of the raw data collected by each analytical method. These data are interpreted by conservation scientists experienced in the particular analytical technique to identify the colorant. As such, only the interpreted results, not the raw data, are given for each print.
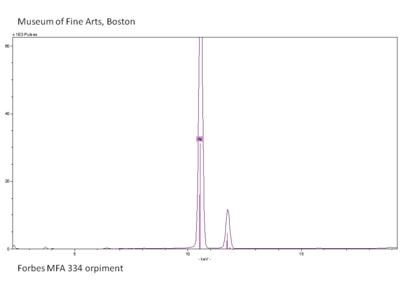
XRF spectrum of Orpiment 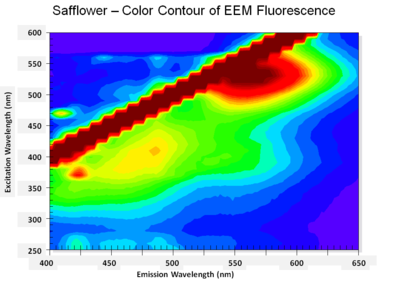
3D EEM pattern of Safflower 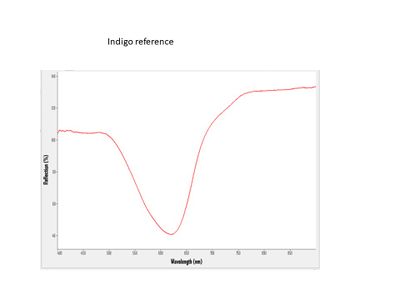
FORS spectrum of Indigo


What colors cannot be identified?
- Faded colors are a challenge and at times not all colors can be fully detected. Although visual observation may give a clue to the colorant or colorants present, only the results from the technical analysis are given. Therefore, if only one colorant of a mixture/overprinting was detected although visually the color is identifiable as a mixture/overprinting, only the detected color is presented in the results. In most cases, XRF, EEM, and FORS still pick up faded colors, but all three techniques are restricted by their detection limits as well as the presence of any fillers and fluorescence in the paper itself.
- Flavonoids are also a challenge. This group of organic yellow colorants containing flavonoids cannot be reliably distinguished from one another with current analytical methods. Dayflower can shift to a greenish blue, yellow, or tan, which also has a similar EEM fluorescence to the flavonoids. Luckily, most times the presence of dayflower can be visually distinguished from the other flavonoids and/or FORS analysis can still detect its presence.
- Orpiment structural form requires the use of Raman spectroscopy.
- Carbon black or sumi, cannot be detected via the three methods and was not actively pursued during this research. Therefore, carbon black used as a color (black, gray, or blue gray) or when mixed with another color is not identified in this database.
Japanese terms for color and materials
Throughout history, many of the colors and materials have had multiple names and still may have multiple names associated with them. For this database, we have tried to use the most common currently-used name for the raw material used to produce the color. For example, orpiment (石黄 sekiō) is also commonly called yūō (雄黄), which is actually the Chinese word for realgar. The Chinese term for orpiment, 雌黄 (shiō in Japanese) has been used to describe orpiment and also gamboge.
Back to Ukiyo-e Print Colorant Database